
For crops like cotton and canola, tracking and measuring flowering can indicate how the plants are retaining fruit. Canola plants, for instance, typically see productive seed pods from up to 60 percent of open flowers.
Flowering measurements can provide an indication of initial yield, helping identify how traits are performing for researchers. It can also help inform input decisions, like whether there is pest or disease that must be treated.
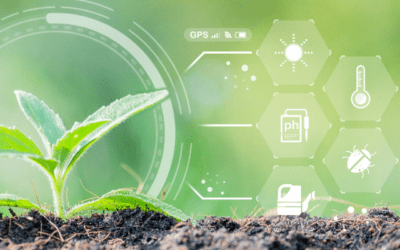
By leveraging aerial drone imagery, we’re able to produce imagery that depicts flowers on the plants as pixels for analysis. Using our data science ecosystem, this is then translated into plant-level measurements for deeper analysis – helping to validate outcomes and maximize the season.
Flower Cover Analytics Overview
With Flower Cover Analytics, researchers and product developers can easily quantify the fraction and uniformity of flower cover across every acre and every plot. In doing so, it helps to characterize crop growth stage, development, and maturity.
Sentera’s Flower Cover Analytics focus on two crops:
- Cotton, after boil opening
- Canola/OSR, after first flowering
Flower Cover Analytics from Sentera are available for plot trial or field scale applications, focusing on solving key agronomic problems associated with these crop types.

How to Use Flower Cover
Because canola and cotton have lengthier flowering periods, plant-level measurements during this time can be informative to plant growth and development. As stated above, there is high correlation between the number of flowers and fruits produced – making this a solid measurement to understand potential yields.
At the same time, because the flowering stage tends to be lengthier, there is an opportunity to influence the success of flowering by applying key inputs during this period. Fungicide applications are often recommended during early-stage flowering (20-50 percent), depending on the product that is used and the disease that will be treated.
Therefore, Flower Cover measurements can be helpful to inform research trials to determine trait selection; but they can also be useful to support product development and understand product efficacy (particularly for those that are applied during the flowering period).
Flower Cover Analytics: What’s Included
When analyzing flowering for canola and cotton, an RGB mosaic can provide high-level insight into flowering levels. Beyond that, Sentera’s Flower Cover Analytics offer insight into the percent of flower cover over a plot or a field.

It also includes insight into the median flower cover percentage, as well as the min and the max to understand which plots and areas of the field may be performing better than others. These insights can help to inform trait selection and product development decisions by having clear indication of where performance may vary based on field-level performance.
How to Capture Flower Cover
While manual, on-the-ground scouting efforts can capture data related to flowering, using aerial imagery helps to augment the scale of data captured and improve the overall accuracy. Because drones can capture a large amount of ground in a short period of time, it also lends itself to more frequent data collection opportunities throughout the flowering period for both canola and cotton.
Choosing the right ag drone system to capture flowering matters. Sentera offers several sensors that are compatible with leading drones to capture this information, producing the required RGB mosaic and key plant-level measurements.
Among these are the Double 4K Ag+ and Multispectral, two key variations of this versatile sensor that offers ease-of-use and flexibility in the field. For those seeking science-grade imagery with the option to capture other types of analytics throughout the season, the 6X and 6X Thermal can also generate Flowering Analytics.
And, the newest sensor from Sentera – the 65R – serves as a solution for Flower Cover Analytics as well. Because of its ultra-high-resolution, the 65R can be flown on a drone at much higher altitudes than other options – at 150 feet – to capture the imagery required for this data set.
Growing canola and cotton presents different challenges than other crops. Because of this, it’s even more important to have detailed insight into crop growth and maturity throughout the season – especially at such a crucial time as flowering can be. With Sentera’s Flower Cover Analytics, it offers deep insight into performance for clear indication of what’s happening – plant by plant. The result? Data-driven insights that help to validate outcomes and maximize the season.
 for a full view into the analytics that Sentera provides for research and product development.
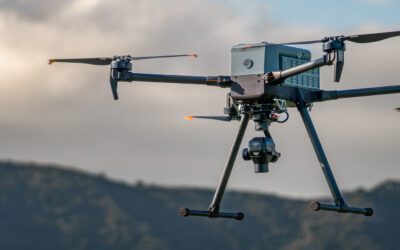
0 Comments