It’s the time of year where tar spot dominates headlines for the ag world, as we start to see this fungal disease crop up in corn plants and negatively impact yields for the season.
While it is most common in the Midwestern United States, but it can also be found in other parts of the country.
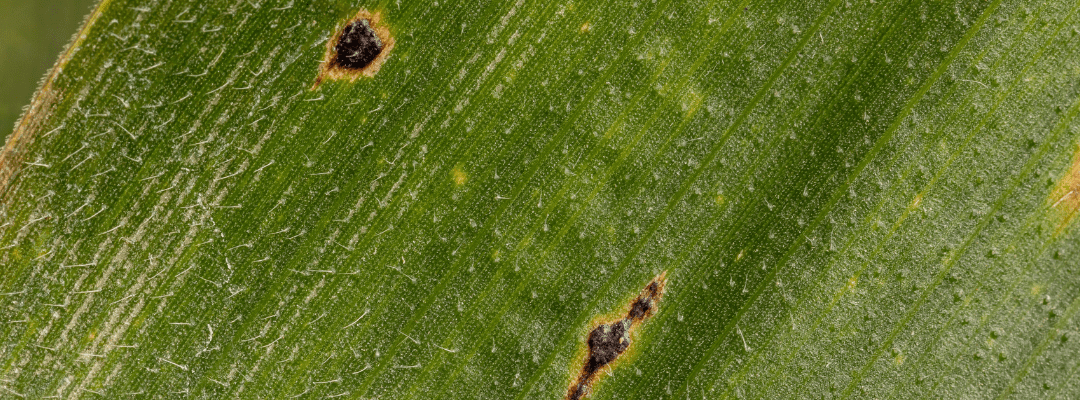
The fungus that causes tar spot – Phyllachora maydis – tar spot produces small, black spots on the leaves of corn plants. These spots can be circular or elongated, and they can be up to 1/4 inch in diameter. The spots may be surrounded by a yellow halo. Tar spot can also produce raised, black pustules on the leaves.
Remote sensing – like using drones to capture aerial imagery – can be a great tool to help identify where tar spot is in the field, as well as see how much its impacted the health of the crop.
But, it can do more than that to help mitigate tar spot’s impact. As ag researchers continue to work with advancing seed traits, remote sensing can be a useful tool in identifying which traits showcase resistance. It can also be used in the product development process to uncover which fungicide treatments work best, and under which conditions.
How Multispectral Imagery Can Aid Research Efforts
Using multispectral imagery can unlock the ability to detect the impact of tar spot before it visibily damages the crop; multispectral imagery captures data from different parts of the electromagnetic spectrum. Because it can capture how light reflects off chlorophyll content in leaves, it can detect plant stress before the human eye can see it.
And, the spectral signature of tar spot is different from that of healthy corn leaves. This means that the reflectance of tar spot lesions can be distinguished from the reflectance of healthy leaves using multispectral imagery. This can help uncover how traits are responding to tar spot earlier than by just relying on manual data collection methods or RGB imagery.
For researchers advancing seed traits to protect against tar spot, using multispectral imagery to generate time series data can be extremely beneficial. This sequence of images of the same area taken over time can be used to track the progression of tar spot and to identify areas that are most at risk of infection.
What’s more, advancements in data science means that this imagery – whether multispectral or RGB – can be translated into detailed data sets and analytics for an even more precise analysis into trait selection and performance. This data can be leveraged to support research findings, or even serve as supplemental in research papers and other documentation.
Some recent studies have focused on the feasibility of using remote sensing to help detect tar spot and its impacts. While tar spot tends to develop from the lower canopy in fields that have an infection history with the disease, a 2023 research article published in Frontiers in Plant Science reported that, based on the study that was conducted, “the results showed that models developed with UAS-based multispectral imaging and machine learning could estimate disease severity for the upper, middle and lower canopy levels exhibiting encouraging performance.:
As digital phenotyping and drone technology become more advanced, the ways in which both can be used to detect and monitor outbreaks caused by various pests, like fungus, will continue to evolve. However, for researchers, it opens the doors to another measurement mechanism that delivers standardized, repeatable processes to validate outcomes.
Informing Product Development with Remote Sensing
Beyond validating tar spot resistance, remote sensing can serve as a viable method of gathering key data points throughout the product development process to help uncover the performance of fungicides.
Three key areas of focus include:
- Monitoring the effectiveness of fungicide treatments. Remote sensing can be used to monitor the effectiveness of fungicide treatments over time. This can help to identify which fungicides are most effective and to optimize the timing and application of fungicides.
- Quantifying the severity of tar spot. Aerial imagery can be used to quantify the severity of tar spot, as well as how it progresses over time. In doing so, it can help to quantify the efficacy of different fungicides.
- Developing new fungicides. Identifying the chemical compounds that are most effective at suppressing tar spot can be done via aerial imagery, either by producing vegetative indices indicate crop health and performance over time; or by leveraging analytics and data sets produced by an advanced data science ecosystem.
In addition to providing direct data to support product development efforts, remote sensing can provide supplemental information that can be useful for product marketing or even sales efforts. They say that a picture is worth 1,000 words and showcasing a side-by-side of how products perform within the same field can be extremely powerful.
The Future of Mitigating Tar Spot with Remote Sensing
Tar spot is relatively new disease in the U.S., as it has only been present for less than a decade. The newness of the disease – and how it reacts and evolves to our environment – can create challenges for growers.
From disease-resistant seed traits to new treatment options, the ag research and product development community is hard at work to mitigate the impact of tar spot – and remote sensing plays a big role in helping to do so.
It goes beyond supporting the data requirements of research trials and product development efforts. By using multispectral imagery and vegetative indices, it can help provide a first-line of insight into tar spot and what it’s doing in the fields. By having early indication of where it may be, and how it’s progressing, it can help accelerate treatment options to limit its overall impact on yields.
 .
.