Sentera’s two most popular crop index products are Normalized Difference Vegetation Index (NDVI) and Normalized Difference Red Edge (NDRE), also known simply as “Red Edge.” In this post, we’ll break down the differences in NDVI vs. NDRE.
Which One Is Right For Your Operation?
Naturally, one of the most common questions we receive is, “Which one should I use?” Typically, our answer is, “It depends,” and that’s because a variety of factors will determine the best option for you. Understanding what these index products do – and what limitations they have – will help you find the answer.
And, to assist you even more, this post will talk through some of the differences in these two products, as well as factors to consider if you’re evaluating a sensor purchase.
Some Background on NDVI and NDRE
Both NDVI and NDRE are called “index products,” and that’s because they’re both constructed from a combination of two distinct frequencies of light.
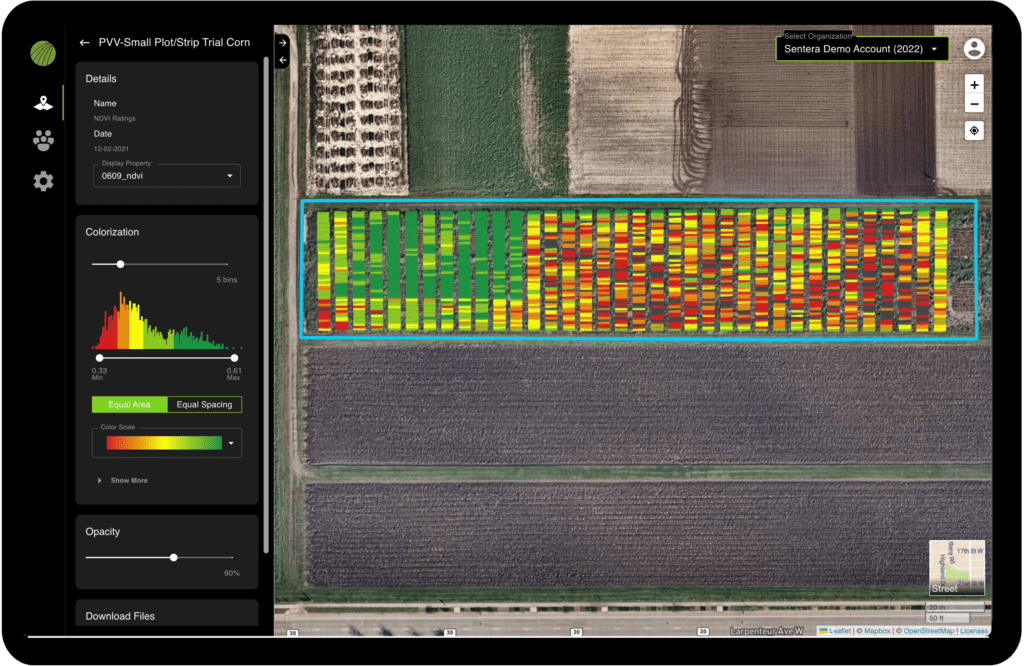
NDVI is a value ranging from -1 to +1 that’s calculated using a combination of visible red light and near-infrared (NIR) light detected with remote sensors. This value quantifies vegetation – or, to put it more simply, it tells us how much green is visible. You could look, with your naked eye, at an example of NDVI imagery and tell, at a glance, whether the area captured has plants.

NDVI Example
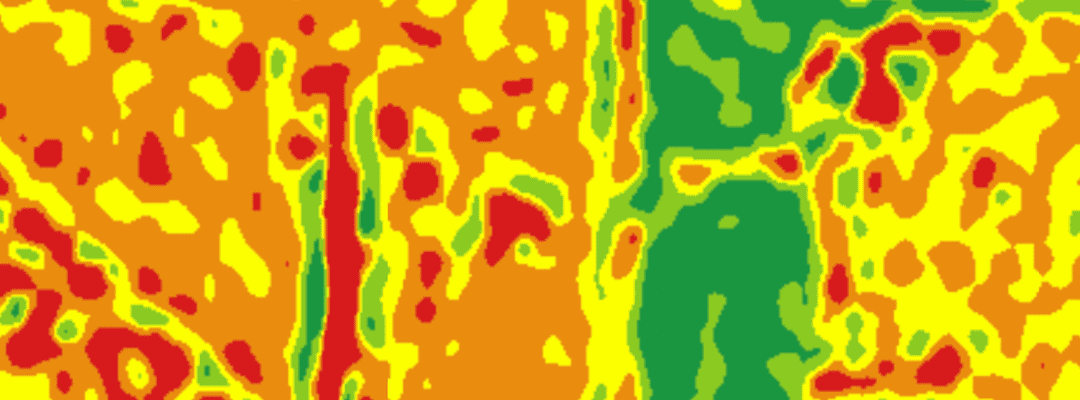
NDRE, on the other hand, is a value that’s calculated using a combination of NIR light and a frequency band that sits on the transition region between visual red and NIR light; it’s also called “Red Edge” for that very reason. It’s another way to tell whether the area captured by aerial imagery contains healthy plants, but in this case, it does so by monitoring chlorophyll content.

NDRE Example
NDVI and NDRE are both straightforward to measure and compute, and are both relatively well-known – but they’re not the only options. In fact, some of the other mechanisms for combining band data and using other bands, such as visual blue or visual green, exist, and some of those products are an attempt to address some of the same shortcomings we’ll talk about in this post. We build sensors for those too, and we’d like to acknowledge that all of these solutions exist, and we do support users who are generating these products and attempting to discover new ones. This post, however, is specifically focused on the factors that differentiate NDVI from NDRE.
NDVI Is More Common
It has decades of history, starting with the original LANDSAT satellite system, where it was developed as a useful indicator of vegetative health.
At a simple level, NDVI is all about what’s absorbed by the plant and what the plant reflects. In healthy vegetation – where there are plenty of green leaves – most of the visible light that hits it will be absorbed, while the NIR light is largely reflected by the plant. In unhealthy vegetation – in which there are few or no green leaves – much of the visible light is reflected, while more NIR light is absorbed. An area that’s dense with healthy vegetation will fall closer to the +1 end of the value range; a value closer to -1 indicates a lack of healthy, green vegetation – or vegetation with no leaves (which can be due to poor health or the stage of the growth cycle).
Most space-based and terrestrial platforms that are used for agriculture, forestry, and similar applications have visual Red and NIR detector hardware, so NDVI has become a well-known, widely-used product.
NDVI is a great general indicator of crop health, and now with drone platforms, NDVI measurements can take advantage of high-resolution imaging to establish measurements during earlier growth stages than were possible or economically feasible with satellite or manned aircraft.
But NDVI Isn’t Perfect for All Crops or for All Growth Stages
Now, even though NDVI is commonly used, straightforward to calculate, and easy to interpret, it does have some shortcomings.
The visual-band red content that is used in NDVI is absorbed strongly by the top of the plant canopy. But, that means the lower levels of the canopy don’t contribute much to an NDVI measurement, which impairs correlation of NDVI to other important measurements, like leaf area index (LAI). Or, to put it more plainly, when you have vegetation with a dense, healthy top canopy, NDVI becomes less useful because it can’t accurately detect the health of anything below it, and this effect increases in plants with more layers of leaves, like tree canopies or later-stage corn.
In addition, in some permanent crops, grasses, and cereal crops, as well as in certain row crops during later growth stages, NDVI runs into the issue of not being able to differentiate between varying levels of healthy green vegetation. Once the NDVI value of 1.0 is reached, it can’t go any further, even if the crop continues to grow. And that means that, if there’s an issue with the healthy plant, it may take more time for any variability in the crop to be detected with NDVI. By the time the NDVI value drops below saturation, the crop may already be damaged.
Red Edge Offers a Solution
Fortunately, where NDVI falls short, NDRE is a great option.
NDRE’s Red Edge band (as opposed to NDVI’s red band) spans roughly 670-760 nanometers, which is between the Visible Red and Near Infrared bands. This matters because that Red Edge is where vegetative stress is first detectable, giving earlier insight into potential issues.
And, NDRE provides a measurement that is not as strongly absorbed by only the topmost layers of leaves as NDVI. Therefore, NDRE can give better insight into permanent or later stage crops because it’s able to measure further down into the canopy. If there’s plant stress, whether that’s due to poor irrigation, disease, improper fertilizer use, or pests, NDRE can detect those changes, even if they’re not yet visible on the surface.
NDRE is also less prone to saturation in the presence of dense vegetation, which might be encountered in pasture biomass estimation measurements. Therefore, NDRE can sometimes provide a better measurement of variability in an area that NDVI would simply measure as a uniform +1.0.
Making a Decision
Now that you understand the basics – as well as the strengths and weaknesses – of both NDVI and NDRE, it’s time to think about how each option can benefit your operation. Here are a few things to consider.
- Because so much historical data and modeling work is based on NDVI, it’s often the best place to start. After all, having all that data available for comparison can certainly speed up the learning curve and help you better understand what your measurements really mean.
- However, if you’ve flown NDVI and have experienced issues with saturation or absorption like discussed above, NDRE might provide an answer.
- Are you dealing with thick permanent crops or other dense crops? You may want to think about starting off with NDRE right away, since those are the exact scenarios in which NDVI struggles.
- And, of course, using both is often the most ideal solution. A lot of our customers with crops that transition from seed to thick canopies in a single season make use of both NDVI and NDRE.
Sentera builds DJI-compatible NDVI and NDRE sensors at several price points. We offer two versions of our High-Precision Single Sensor that can do one or the other, and versions of our Double 4K Sensor that can do both NDVI and NDRE at the same time. Some models of the Sentera Double 4K Skyport, which is compatible with DJI’s M200 and M210 Enterprise equipment, can also do NDVI and NDRE simultaneously as well as capture Live NDVI video that is streamed to your device while your drone is still in the air.
With so much variability, based on crop selection and management strategies, the best resource for determining which products make the most sense for your operation is your agronomist or advisor. An expanding library of scientific literature can also offer crop and practices-specific information about remote sensing approaches, including NDVI and NDRE.


