With field trial season well underway, many researchers are starting to evaluate the tools they are using in their plot trial research to know whether they are a suitable solution to get the analytics they require. Eliminating any variability and instituting quality control serves as paramount; as even the smallest variation in accurate reporting could sideline a trial.
In recent years, using multispectral measurements – whether captured via drones or satellite – has become more popular among researchers. The technology has advanced so it has the capability to capture accurate and precise measurements that are required for research. In doing so, it provides another data set to understand performance.
But, it requires the right equipment and resources in order for it to be effective and give researchers the data and insight they require to make critical decisions. With this type of imagery, there’s the opportunity to take it one step further than what’s standard to truly minimize variability and capture accurate measurements.
Compute Indices with Five-Band Imagery
Satellite imagery can give researchers insight into five-band imagery to give a detailed look at performance throughout the growing season.
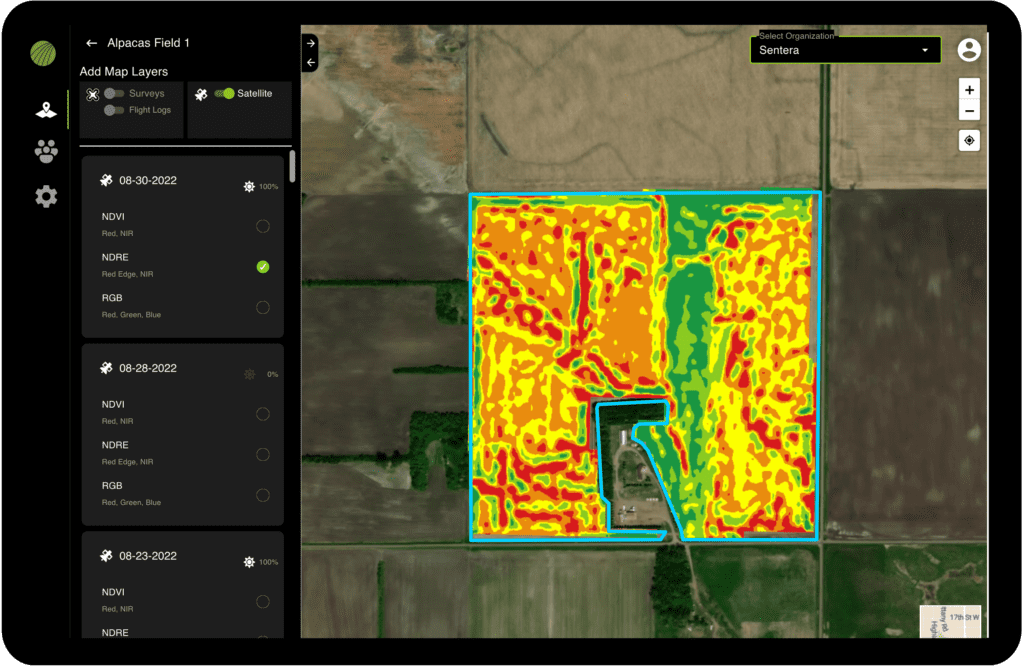
Sample image of NDRE index
Two of the most popular visual indices are Normalized Difference Vegetation Index (NDVI) and Normalized Difference Red Edge (NDRE), which are meaningful metrics for comparing the performance of different plots over the course of a season. NDVI and NDRE both capture five bands:
- Red
- Green
- Blue,
- Infrared (NIR)
- Red edge (REDGE)
NDVI calculates its measurement based on Near Infrared (NIR) and red, while NDRE analyzes the NIR and Red Edge (RE), which is a spectral band that is located between the NIR band and the red band without any overlap. Each of these have different uses; NDVI tends to be better for mid season where it captures visible green coloring wherever vegetation is present – but the measurement often saturates once the canopy cover gets too dense. That’s where NDRE comes in, since it measures red edge, it can more accurately pull in chlorophyll saturation and how it relates to the cellular structure of the leaves. Most small plot research is conducted with plots too small to measure from satellite imagery with one, three, or even 10 meter resolution. Leveraging a cutting edge drone-based multispectral sensor featuring radiometric calibration enables a new class of measurements for plot research.
The Benefits of Radiometric Calibration
Radiometric calibration removes variability caused by variations in lighting conditions on different days, such as the sun’s position in the sky and the thickness and density of clouds. All that means you can make quantitative comparisons over time.
For instance, if you are measuring NDVI at 0.7 today and it measures the same next week; this will be meaningful as you don’t need to consider variability. Radiometric calibration can easily be added to a sensor like Sentera’s 6X by adding a reflectance panel, which enables calibration given the conditions we noted above, whether it’s the position of the sun or the presence and characteristics of clouds, or movement of clouds during aerial imagery capture. The panel provides a consistent reflectance surface spanning both visible and near-infrared spectral bands.
Reflectance panel based calibration can be further augmented by using an incident light sensor. An incident light sensor measures incoming light, which can vary throughout a flight as clouds move across the area, or even as cloud thickness or moisture content change on an overcast day. Adding an incident light sensor allows the ability to precisely compensate for changes in ambient lighting conditions.
What’s even better? Once you capture this imagery via the 6X + Reflectance Panel + Light Sensor, you can easily order a Calibrated 6X Mosaic via FieldAgent Desktop to truly quantify and understand performance without needing to accommodate for nature’s variability.
 to learn more on limiting variability in aerial imagery.