The only predictable element in agriculture? The unpredictability. There will always be a factor of not knowing whether the growing season will start late due to cold conditions; or if a flash drought may happen because of warmer-than-average temperatures.
When it comes to seed production, this variability directly correlates to profitability – lower yields result in less seeds that can be sold. And, what adds to the complexity, is that sales teams often start selling hybrids while they are in production in order to take advantage of early pricing gates.
Yield variabilities themselves can create challenges, especially if sales then oversells the availability of a hybrid seed. This can lead to a poor customer experience and results in frustration on both sides.
Accurately forecasting seed production yields requires a detailed look into the data throughout the growing season to understand what is happening at the field’s edge – no matter where the field may be located. With the ability to extract the same measurements across all fields, it helps producers truly understand what yield may be and accurately forecast what may be available to sell.
Aerial imagery provides the best opportunity to gather essential data points throughout the season. This means that you can understand what is happening across all acres, no matter what region, at once.
Let’s look at some of the key data analytics that can be captured for seed production.
Stand Count
Stand assessments give the earliest indications of field health by indicating key data points related to emergence. When using aerial imagery to capture Stand Count, it can result in more detailed data points – including plant population and emergence percentage, as well as statistics related to seed spacing, seed gaps, plant area, width, canopy, and weed pressure. This data helps inform the next best action for addressing concerns in the field.
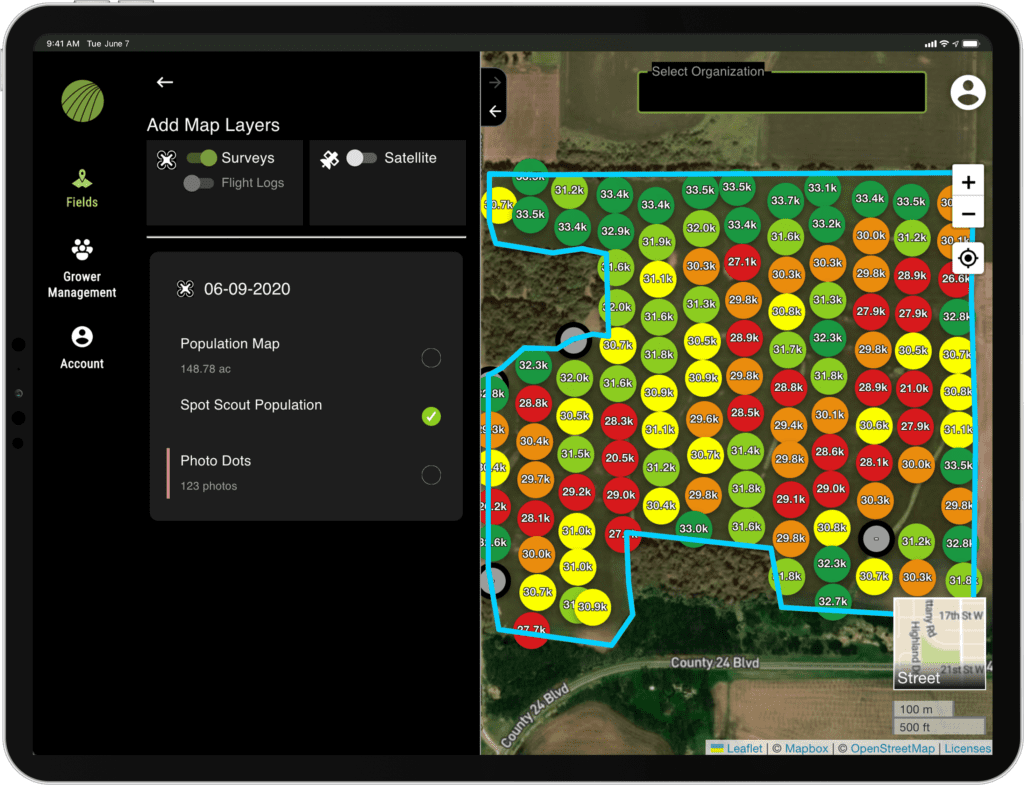
Example of Stand Count in FieldAgent
Crop Health
Throughout the season, crop health can be captured via satellite or sensors to understand health, maturity, and stress. At a very basic level, this will give clear indications of exactly what the plants in the field will need to thrive – from increasing irrigation levels to honing in on areas with dense weeds throttling growth.
Multispectral indices, like NDRE and NDVI, provide a more detailed analysis into performance, which helps to inform crucial decisions.
These indices can be captured using satellite data to get a broad indication of performance. Drones and sensors provide another level of precision when capturing this information to ensure that the readings help measure outcomes by removing the variability.
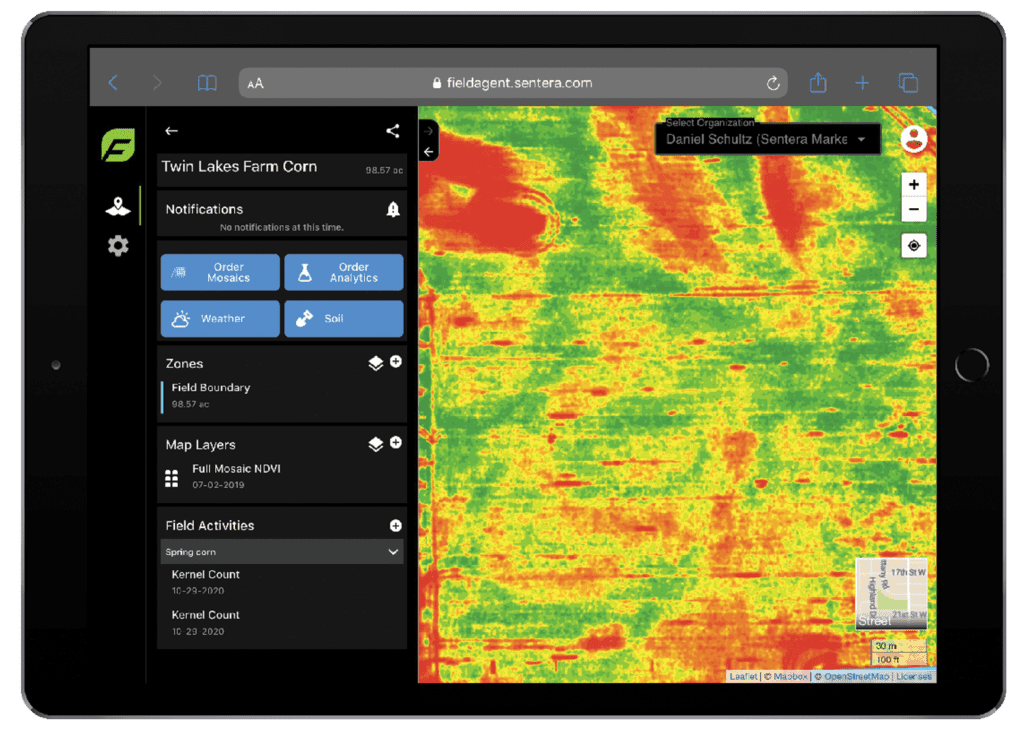 Example of Crop Health in FieldAgent
Tassel Count
Many view Tassel Count as the last indicator of end-of-season yield; and while it is a great tool for that, it can be leveraged for so much more. Understand how your plants are performing and see if there are any critical management decisions that can be made to add to the yield. For seed production, Tassel Count helps to confirm forecasted numbers and support sales motions for the coming season.
While capturing aerial imagery doesn’t completely remove the unpredictability of Mother Nature, it does offer some control by giving deep insight into how the crop is performing so you can quickly make decisions to maximize outcomes before it becomes too late and significantly impacts profitability.
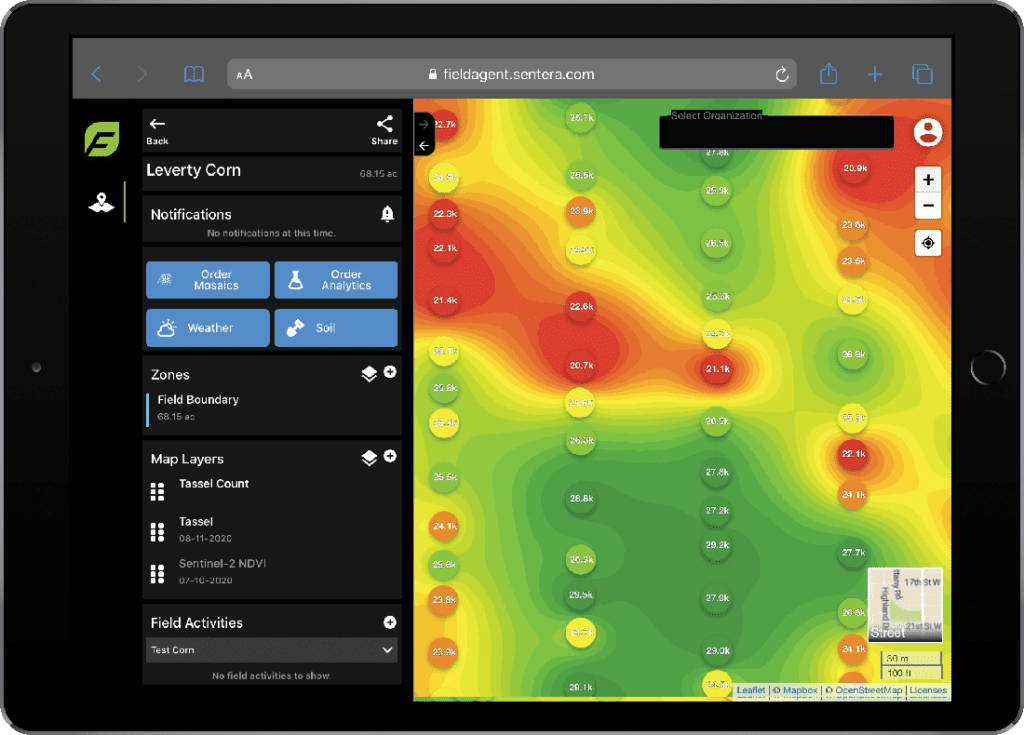
Example of Tassel Count in FieldAgent
 - download it for more insights on how to utilize data to optimize your successes.