The process of designing and managing an effective plot trial can be a challenge, requiring a considerable investment of time and resources. Of course, it’s all worth it once you’ve gathered the key outcomes that allow you to make the critical decisions that data will influence, but to get the most out of the effort you’ve put into your plot trial, there are several things to consider when it comes to measuring, collecting, and analyzing that data.
Optimizing Data in Agriculture
With that in mind, remember – measurements matter. In order to guarantee the most accurate data possible, your measurements must not only be precise, but reproducible, quantitative, and, of course, they have to have agronomic relevance. After all, data on its own doesn’t have intrinsic value; your measurements, data, and analytics only become valuable if they provide you with insights that help you achieve your goals. Otherwise, it’s simply noise.
The scalability of your data collection methods is similarly important. With your current method of collection, can you increase the quantity and type of measurements you’re taking without sacrificing accuracy?
And – here’s the truly tricky part – can you do so at the same cost, or for even less?
If not, perhaps it’s time to reconsider your go-to methods. The technology to make this feasible exists, and if you’re not taking advantage of it, you could be missing out on the opportunity to grow.
The Art of Collecting & Analyzing Data
When it comes to collecting (and analyzing) data in agriculture, objectivity is also key – and, again, this is an area where the right resources and technology can make all the difference by reducing your reliance on subjective or qualitative methods by using image-based processing pipelines.
During your plot trials, visualization in the form of real-time monitoring of crop performance and the ability to detect management-related issues that you can correct is a game-changer. The use of drone services and satellite imagery provides researchers with insights into crop performance at every stage of the growing season – insights that otherwise wouldn’t be accessible in a quantifiable manner using solely manual methods.
For instance, take five-band imagery, like Normalized Difference Vegetation Index (NDVI) and Normalized Difference Red Edge (NDRE), which each capture five bands: red, green, blue, infrared (NIR), and red edge (REDGE).
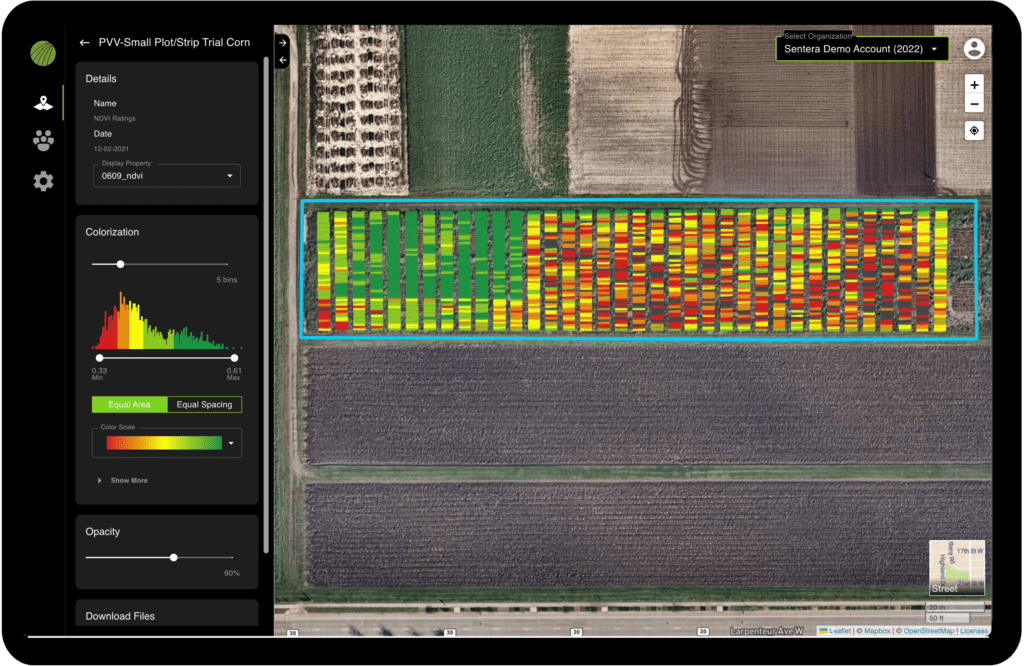
Using NDVI in mid-season can be incredibly informative, since it captures visible green coloring when vegetation is present, giving you an accurate idea of how those young plants are faring.
But later in the season, when the canopy cover becomes denser, that green becomes saturated, making NDRE a better option since it measures red edge and more accurately pulls in chlorophyll saturation, providing the insight you need to determine plant health at that stage. This type of visualization is a straightforward, fast, and efficient way to help you clearly understand exactly what’s happening in the field at any given time.
Using Data in Agriculture to Get to the End Goal
And, finally, remember to focus on your research objective right from the start. What is it, exactly, that you need to learn from your plot trials, and precisely what data do you need in order to garner that knowledge? A narrower focus dovetails nicely with improved efficiency since it helps you avoid being distracted by unrelated findings.
In product development, time is money, and while you can’t necessarily speed up the growth of a plant, you can increase velocity of your trial and data collection by asking and answering the research and product development questions that relate directly to your goal – and that reduces the burden and cost of any experimental data collection that doesn’t specifically impact your objective.
 for more information.