
In the past year, labor shortages have hit the agricultural industry hard. In fact, reports show that there are more than 50 percent less hired workers on the farm compared to previous years.
And this extends beyond help for farmers. For agronomic advisors, resources are slim and it requires a new approach to managing resources to get everything done.
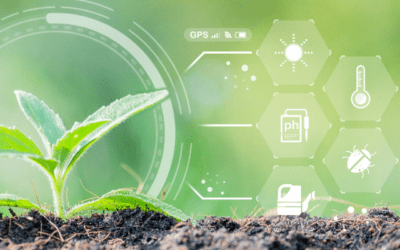
Within that is the adoption of technology to help capture data and provide insights into key areas of focus. At the onset of data in agriculture, there’s a focus on gathering as many data points as you can, digging deep into the data, and figuring out what the trends are – but now, there’s a rebirth of spending time where it matters most.
After all, agriculture is plush with data – it’s estimated that 500,000 data points are generated by every farm and this number is predicted to grow 8x in the next 15 years. Too much data is just as challenging as not having enough data, as the influx can make it challenging to have the time to analyze and understand where to focus.
How to Use Satellite Imagery for Ag Insights
In recent years, satellite imagery has made rapid improvements where it can provide deep insight into the performance of crops. Satellite imagery captures multispectral bands like NDVI and NDRE to provide an indication of how plants are performing; based on the amount of chlorophyll within the plant at certain times in the season, it will reflect a different color.
It isn’t perfect – there are some limitations with using satellite imagery. Often times, cloud cover has a negative impact and it doesn’t provide the level of detail that is often required for a detailed analysis for what’s happening at the field level.
However, what it does is help agronomic advisors cut through the noise to understand what is happening and where they should be focusing their time. With thousands of acres to monitor throughout the season (and many other things on the to do list), finding ways to prioritize scouting can result in:
- Better focus and attention to detail
- More informed decisions
- Ability to provide even more value with every grower interaction
Clipped Satellite Imagery in FieldAgent
To help better inform scouting activities, Clipped Satellite Imagery is now available as a feature within FieldAgent. Clipped Satellite Imagery results in the satellite imagery clipping to your field boundaries, so you only see the results for the area of land that’s important to you.
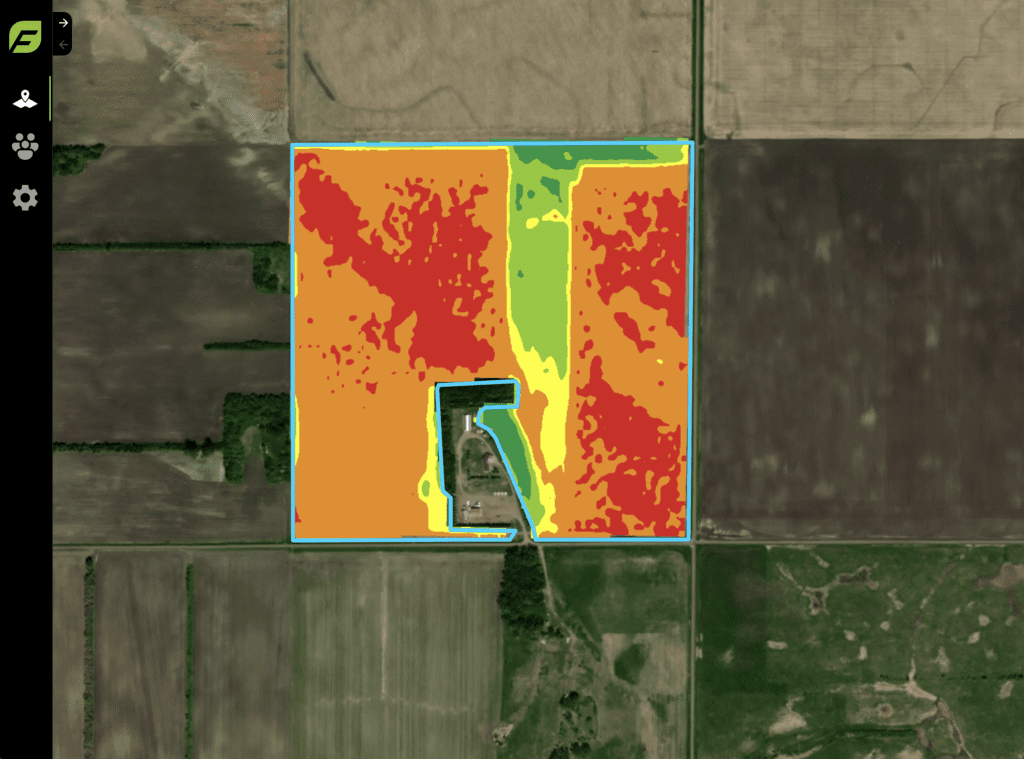
This extends beyond a more friendly user experience. Within FieldAgent, users have the option to analyze data based on Equal Area or Equal Spacing.
What is Equal Spacing?
If you are using Clipped Satellite Imagery, data visualization will be showcased via Equal Spacing. This means that when you look at the representative colors – or bins – each color will have a set value range. If you have five colors, for instance, they will each represent one fifth of the value range.
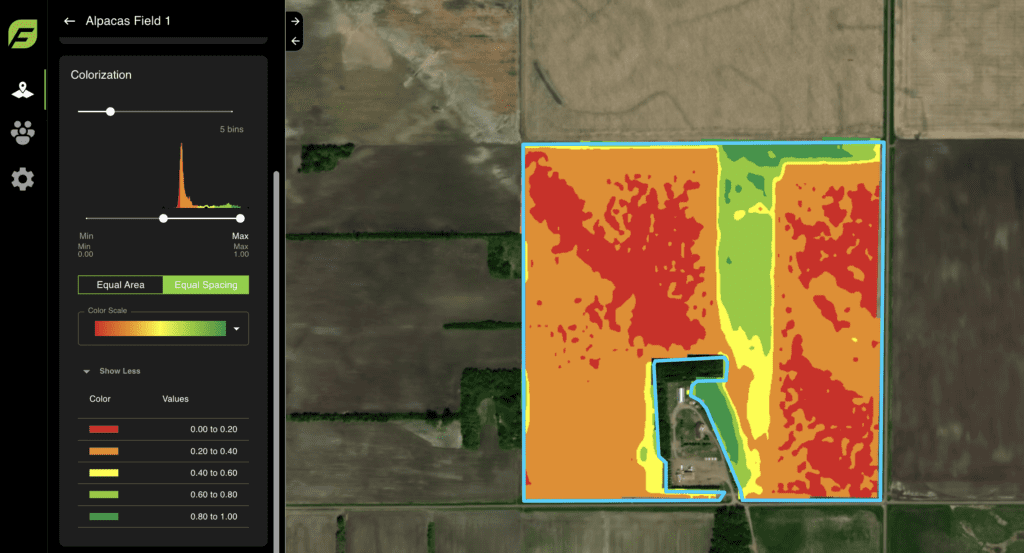
Why is this helpful? It gives you a good indication of how things are performing across the field. There may still be variation on the field depending on where the values fall. But by design, it will make it easy to understand the top and bottom percentiles of the field.
What is Equal Area?
On the flipside, Equal Area requires that you have Clipped Satellite Imagery turned on. This will showcase the representative colors so that each color has the same amount of area within the imagery. If you are using five colors, you will see all five colors represented equally.
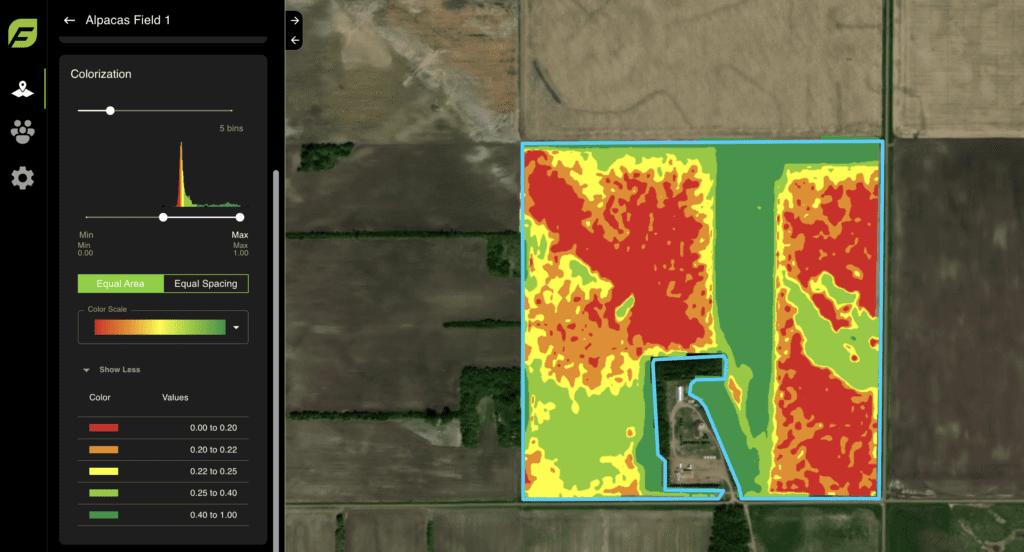
Why is this helpful? This gives you insight into where your problem areas may be by forcing higher contrast within your field. This means that identified problem areas may not be problematic compared to other fields. But given performance in that field, it may be performing worse than other areas. Variations of even .10 of a value can indicate a big difference depending on where we are in the season. So, Equal Area provides an indication of how the field looks at a point in time to help inform boots-on-the-ground scouting activities.
With insight into low and high-performing areas within the field, agronomic advisors are empowered to focus their time where it matters most – spot scouting key problem areas and having informed conversations with their growers.
Scouting with Drones
While satellite imagery gives a quick indication about how things are performing, leveraging ag drones and sensors can give a more precise view into crop health and performance. It can be a useful tool to help scout, especially when you have large swaths of acreage that call for attention.
Plus, you can augment your spot scouting focus areas with access to more detailed reporting and analytics. This helps to provide data-driven advice to growers when informing them about performance and the next-best action to maximize outcomes.
 for a FieldAgent subscription!
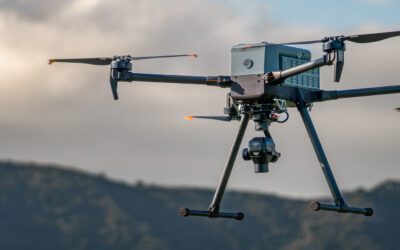
0 Comments