When going through the process of formulating and answering your agriculture research questions, ag data plays a critical role in determining results. Data collection has historically leveraged manual crop scouting; this isn’t always the most effective method due to the potential for human error and the inability to gather as many data points as a research trial may require.
To make the data collection process more efficient, and also more accurate, ag technology has become more prominent than manual data collection methods. Whether it’s RGB imagery or multispectral from either drone or satellite imagery, using remote sensing solutions can capture the insights needed to validate your research.
And, because data collection and its processes are critical to research success, it may require a deeper look into how this technology may augment your research study. This could impact how you set up your research, as well as key milestones along the way. Ultimately, the way you use remote sensing comes down to your use case and the data you are seeking.
Getting a Bigger Picture with Satellite Imagery
Satellite imagery truly gets the bigger picture – capturing data from multiple fields to an entire region at once. This comes in handy when making these comparisons across fields or plots in less time and in fewer shots. Satellite technology helps in determining crop type, species, and growth stage of crops over a big region. Satellites are also continuously capturing images, making comparisons over different periods of time more accessible.
Satellite imagery isn’t necessarily used for the nitty gritty details but is most valuable in capturing and forecasting yield potential. When wanting to look at large-scale productivity and general crop quality, getting this view of multiple plots or fields can give a better indication of major trends.
Let’s take drought for instance; multispectral imagery from satellite imagery can show the impact of these conditions across a region. While you are not getting high-resolution imagery that allows you to focus closer on individual plants, you’re able to observe these bigger trends and reactions to environmental, input, or product changes.
Leveraging RGB Imagery to Explore Your Agriculture Research Questions
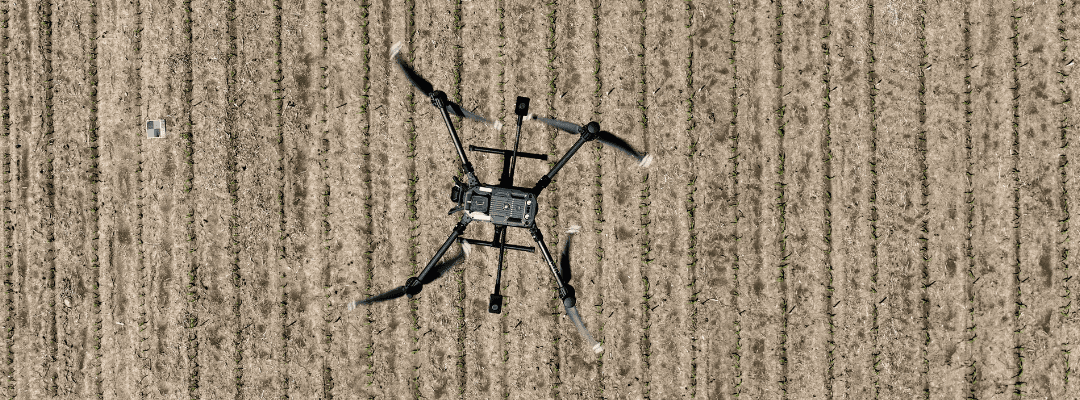
RGB imagery is essentially what can be seen by the naked eye, whether from an aerial view or up close with ground cameras. While ag drone systems can be used to capture aerial RGB imagery, it can also be captured by snapping a picture with a camera at the ground-level to get a closer look at the plants. This type of imagery is ideal for phenotyping and assessing physical characteristics like size, shape, and identifiable stress.
The perk of using drones to capture this imagery is assessing the entire plot(s) at once and directing you to specific problem areas – directly informing boots-on-the-ground scouting. Instead of walking plots and seeking these areas, it helps to direct you to where your attention needs to be or areas in need of ground level images.
This is also beneficial when comparing one plot to another; having a picture of the entire plot better exhibits performance and makes comparisons easier. Let’s think of tillage for example. If you’re exploring or comparing tillage practices on plant growth and productivity, RGB imagery can provide the necessary insights to determine if the tillage practice impacted plant growth and population across the differing plots.
One of the most valuable analytics generated from RGB aerial imagery is Stand Count – which can be used to better understand emergence and plant population. It can also help to measure uniformity, which can be an essential data point when evaluating traits and performance.
In the example shared previously around tillage practices, Stand Count analytics can measure differences in emergence patterns, identify which areas experienced growth problems, and help to inform the next steps and validate outcomes.
Digging Deeper with Multispectral Drone Imagery
On the flip side, multispectral imagery (by both drone and satellite) picks up on things that may be missed by the naked eye. Using an ag drone system allows you to get more specific data to individual plots versus larger regions seen with satellite imagery. Unlike multispectral satellite imagery, multispectral drone imagery has a lower ground sample distance – or the size of the pixel. With satellite imagery, a pixel may be 10 meters, while aerial imagery captured by drones can have a ground sample distance of a few centimeters. Because of this, high-resolution imagery serves as an excellent resource to focus more on the plot and even down to the plant.
The high-resolution quality and precision offered by ag drone sensor result in more accurate imagery and insights into crop vigor throughout the season. This may include key things like:
- Various types of crop stress
- Crop health over time
- In-depth product performance
- Temperature measurements
Technology like Sentera’s 6X Thermal Sensor goes beyond multispectral imagery by capturing this high-resolution imagery with an indication of temperature measurements across your plots. By monitoring and understanding temperature throughout your field, heat stress becomes more identifiable. It can also help to better inform irrigation systems.
The Final Question: How Does This Impact Research?
With the ability to tailor remote sensing technology to meet the requirements of specific use cases, it truly has a place in every aspect of research. What’s most important is determining what may make the most sense, given what you’re trying to achieve.
If you’re looking for higher-level insight into research performance, or even to prove out the differences in traits or products across a larger area, satellite imagery may fit the bill.
But, if you want clear insight into what the plant looks like – how it may have responded to a fungicide or other application – this is where RGB imagery can really shine.
For a deeper dive into analyzing abiotic and biotic stress response, especially if certain factors can be measurable, multispectral imagery can expose essential insights into trait and product performance.
And, for many researchers who are adopting remote sensing to support their research efforts, it may be something that starts with a goal to prove its value – by either replacing a key measurement or two or by complementing a measurement technique that’s already in place. This helps to validate outcomes while building confidence around the potential of remote sensing in research.
 , to learn more.