Ag technology has never been more vital in gaining precise and timely insight into what’s occurring at the field-edge. Aerial imagery captured by ag drone systems and satellites has made data collection more efficient than ever.
While RGB aerial imagery provides valuable insights into what is going on in your plot or field by giving you a clear image of your crops, you are essentially only seeing what the naked eye can see. What if you could unlock deeper ag data analytics to gain a deeper understanding of your plants?
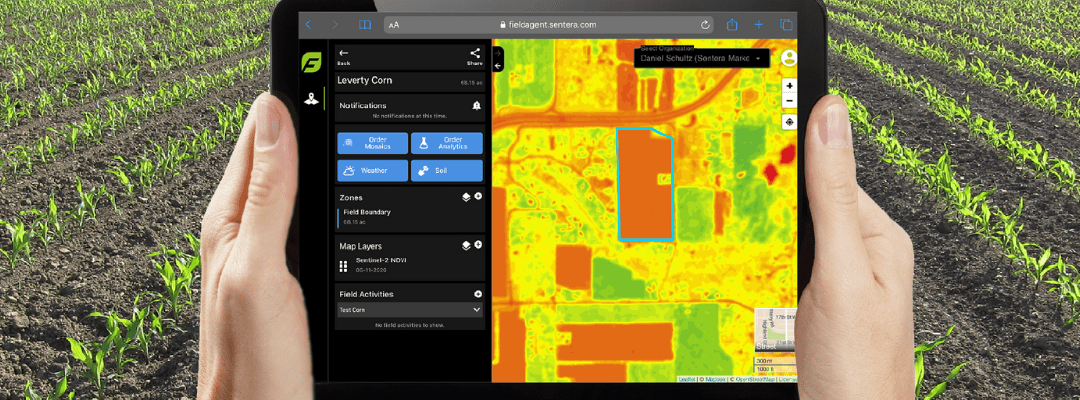
This is where multispectral imagery provides deeper ag analytics. You’re provided with a more in-depth look at crop health and growth throughout the season to assist in powering critical decisions and validating outcomes.
Breaking Down Multispectral Indices: What is NDVI?
Multispectral imagery goes beyond what is seen by the eye and takes data capture to the next level. By using different light bands, this technology is able to pick up on plant stress and measure the health of plants. RGB is considered three-band imagery (red, green, blue) and multispectral imagery includes additional bands to capture data across the electromagnetic spectrum to understand how light reflects within a particular wavelength.

Chart from DroneWorks Highlighting Wavelengths
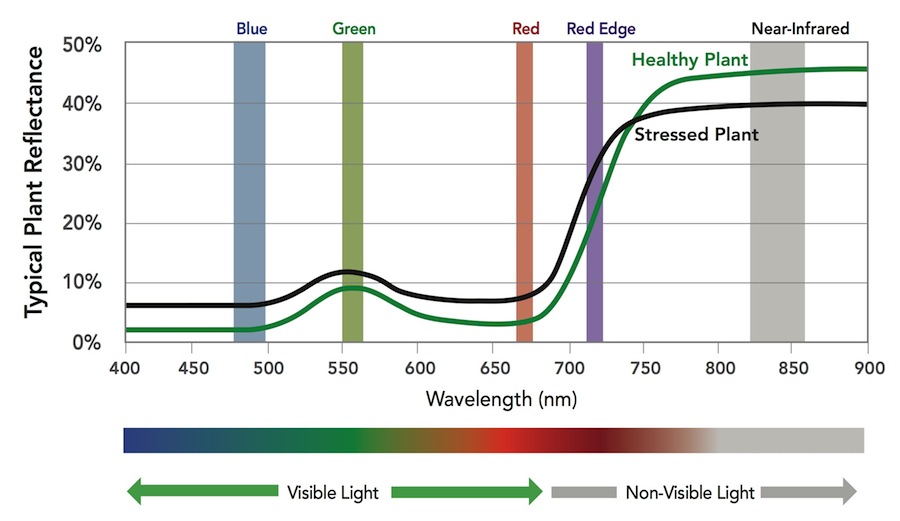
Now, why is this important? In the case of plant health, the light reflects differently based on varying chlorophyll levels, which is a key indicator of how a plant is performing.
One of the most common multispectral indices is Normalized Difference Vegetation Index (NDVI). This index ranges from –1 to +1 that is calculated by using a combination of visible red light and near-infrared light detected with remote sensors – quantifying vegetation. Healthy plants absorb more light to fuel photosynthesis and produce chlorophyll. NDVI revolves around what is absorbed by the plant and what the plant reflects. This allows you to essentially see how much greenery is present and visible.
Since its inception five decades ago, NDVI has been accessed via satellite imagery – making it easy to get initial insight into the field and overall performance.
Ag drones and sensors have further advanced this process by generating multispectral indices and providing more precise and efficient data. The ability to capture otherwise undetectable indicators into crop performance in a timely manner further enhances data collection. From tracking plant health to informing critical decisions, it helps to provide valuable insight that can lead to a more productive year.
")
Using NDVI Imagery to Optimize Your Season
NDVI imagery is used to gather insights to inform decisions that assist in maximizing yield potential. By uncovering key analytics like Crop Health that assist in informing critical decisions that can impact overall productivity and yields. This early insight allows you to make the adjustments you need without taking an unnecessary blow to your crop development.
Multispectral imagery uncovers a deeper look into field performance from before planting to end-of-season insight into what occurred throughout the year. Starting at literally the root of the crop, NDVI imagery has the capability to help in identifying pre-planting soil preparation and field treatments. Early-season insight on areas like emergence allows you to make timely decisions for replant that allow you to. And monitoring crop behavior continues throughout the season to better inform decisions throughout each stage of the growing season.
With the help of NDVI imagery, you’re able to monitor where inputs are needed and how crops are reacting to them. By better informing application decisions, you’re able to optimize the use of key inputs – reducing costs and environmental impact.
Can NDVI Imagery Predict Yield?
Indication of end-of-season yield starts early with the help of today’s available technology and analytics. NDVI’s ability to analyze the density and vigor of vegetation allows for greater insight into crop growth and development. This look into performance and identifying patterns and growth within your fields or plots provides an indication of yield potential. Gaining these insights throughout the season better informs decisions and predicts outcomes.
And early indication of yield doesn’t stop with NDVI. There are a variety of analytics that also use multispectral imagery to provide a look into field performance and are more indicative of what your yield will look like. Specifically, Tassel Count serves as a late-season analytic that can give insight into crop yield and production quality. With the option to leverage a male/female option, it can help validate detasseling operations as well.
Early prediction of crop yield allows for adjustments to be made and gain insight into end-of-season yields. Between the growing demands associated with a quest for augmenting food productivity for the growing population, meeting sustainability goals and initiatives, and driving general profitability, we all need and want more productive seasons. Early indication of yield is going to better inform decisions that need to be made and gauge the year’s productivity.
 .
.