Orthomosaic maps are a powerful tool for crop monitoring and management. They can be used to identify areas of stress or disease, track crop growth, and optimize fertilizer and pesticide applications. By leveraging orthomosaic maps, ag researchers, product developers, retail agronomists, and growers can maximize their efficiency and productivity.
To optimize this useful tool, it’s important to understand the ins and outs of orthomosaic maps, how they are used, and what the different types may be (and how those are created!). So, let’s dig in.
What Are Orthomosaic Maps?
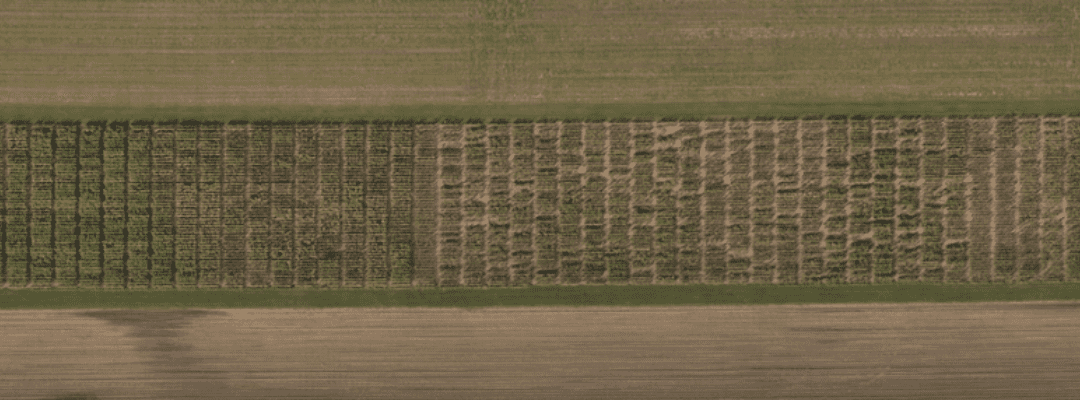
Orthomosaic maps are high-resolution images generated from aerial imagery captured by drones. When a drone flies over a field, the images are captured with some degree of overlap. In doing so, it ensures the accuracy of collected data – and delivers 100% aerial coverage, which is a benefit of using drones to capture data in agronomy.
The imagery captured by the drone or aircraft can be in the form of RGB (Red, Green, Blue) images, which represent the visible spectrum similar to what the human eye sees. Additionally, some systems also capture images in other spectral bands, such as near-infrared (NIR) or thermal infrared (IR), which can provide valuable information about plant health, stress, and other parameters.
Once the images are captured, specialized software is used to process and stitch them together, aligning them based on common reference points. This process takes into account the overlapping areas and geometric information from each image to create an orthomosaic map. The resulting map provides a georeferenced and visually accurate representation of the target area, allowing for detailed analysis and measurements.
However, to get an orthomosiac map – or “mosaic” –the stitching process to create these can often be cumbersome. In recent years, technology has advanced so the user doesn’t have to do the stitching themselves (although that is still an option – and often a great one for the cost-conscious!).
This or That: Different Types of Orthomosaic Maps
Beyond the spectral bands that are captured in imagery and stitched together to form an orthomosaic map, there are two key types of mosaics that should be considered, depending on specific use cases.
Precision-aligned orthomosaic maps refer to orthomosaics that have been carefully processed and aligned with high accuracy to match a specified coordinate system or ground control points (GCPs).
The alignment process ensures that the orthomosaic map accurately represents the true geographic locations and features on the ground. Precision-aligned orthomosaic maps are essential for applications that require precise measurements, such as distance, area, or accurate spatial analysis.
Masked orthomosaic maps are orthomosaics that have undergone a process of masking or selective removal of specific areas or features. The purpose of masking is to exclude unwanted or irrelevant elements from the orthomosaic, allowing a focus on the areas of interest. This can be extremely helpful in isolating specific plots or field sections for individual analysis.
The choice to use precision-aligned or masked orthomosaic maps depends on the specific research objectives and the level of accuracy and focus required for the analysis at hand, which we’ll get into more detail in the following section.
How Are They Used?
There are several different use cases for orthomosaic maps, each depending on the use case at hand and how the data will be used to inform decisions or validate outcomes.
For ag researchers and product developers, there are a few key areas where mosaics can play a critical role:
- Monitor and execute field trials by getting insight into the performance of plots, precisely allocating treatments, and reviewing trial progress
- Assess key traits for crop phenotyping and breeding programs, helping to inform the selection of plants with desired traits
- Identify disease hotspots, pest infestations, and areas of vulnerability, which can inform control strategies while evaluating the efficacy of disease and pest management practices
- Assist in climate change studies by assessing land cover changes, monitoring habit loss, and evaluating overall ecosystem impact
And one of the significant advantages of orthomosaic maps is the ability to enable real-time crop monitoring. By capturing frequent drone flights and generating up-to-date maps, they can be used to monitor crop health and growth patterns. Orthomosaic maps help identify crop stress, disease outbreaks, and nutrient deficiencies, allowing for timely interventions and adjustments in crop management practices. This real-time monitoring capability ensures that issues are addressed promptly, improving crop yields and reducing losses.
What is the Future of Orthomosaic Maps?
Mosaics provide necessary detail into crop health and performance, helping to augment monitoring and provide an essential data layer for analysis. However, with the ability to use machine learning and artificial intelligence to translate aerial imagery into detailed plant-level measurements and insights, there are additional resources that can be used to get deeper, more accurate data about how plants are performing within plots or across an entire field.
And technological advancements continue to transform how quickly data can be collected – and analyzed – to produce accurate maps of what’s happening right at the field’s edge. For instance, Sentera’s Direct Georeferencing (DGR) System eliminates the need for stitching with the ability to capture imagery with absolute location certainty – reducing the number of images required by more than 70%.
Even as technology evolves and more data sets are translated from aerial imagery, othomosaic maps will likely continue to have a place in agronomy. After all, they provide a view into what’s happening in the field – and this snapshot in time can be useful to inform key decisions in and post-season.
 .
.