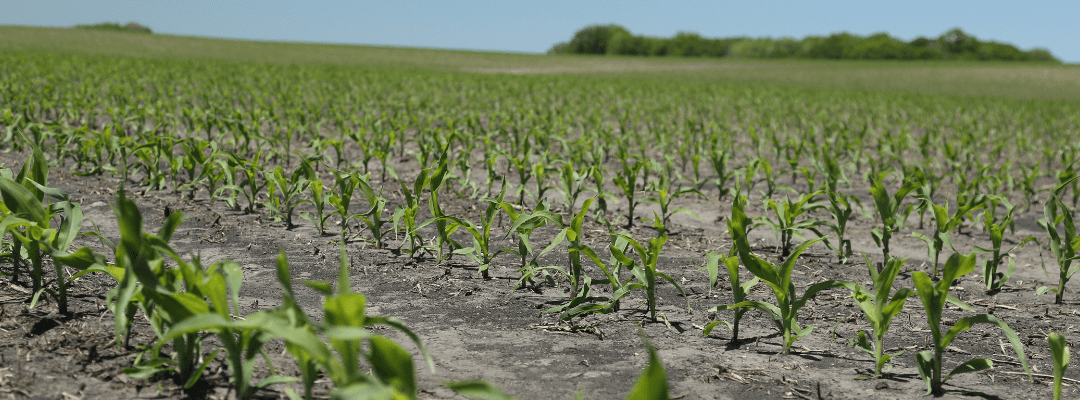
Crop emergence officially waves the green flag for the start of the season – as we all know, that’s when the real fun begins! For agronomists, data-driven insights can provide detailed data and an early indication for crop health and performance.
Before capturing aerial imagery was an option, Stand Count was determined in a variety of ways – with some using hula hoops and other mechanisms to lend accuracy to spot counts across the field.
Using drone technology to capture aerial imagery, which are later translated into detailed analytics via machine learning, agronomists can now rely on detailed measurements to get early insight into what the season may hold.
Stand Count Overview
Stand Count provides plant population count and emergence percentage across a plot or field. For researchers and product developers who require more detailed insight, it may also include key measurements related to uniformity measurements to identify skips and areas that may hinder outcomes later in the season.
This analytic can be captured for several crops:
- Corn/Maize
- Soybean
- Cotton
- Canola/OSR
Sentera offers several different Stand Count analytics products, depending on the use case and purpose for using Stand Count.
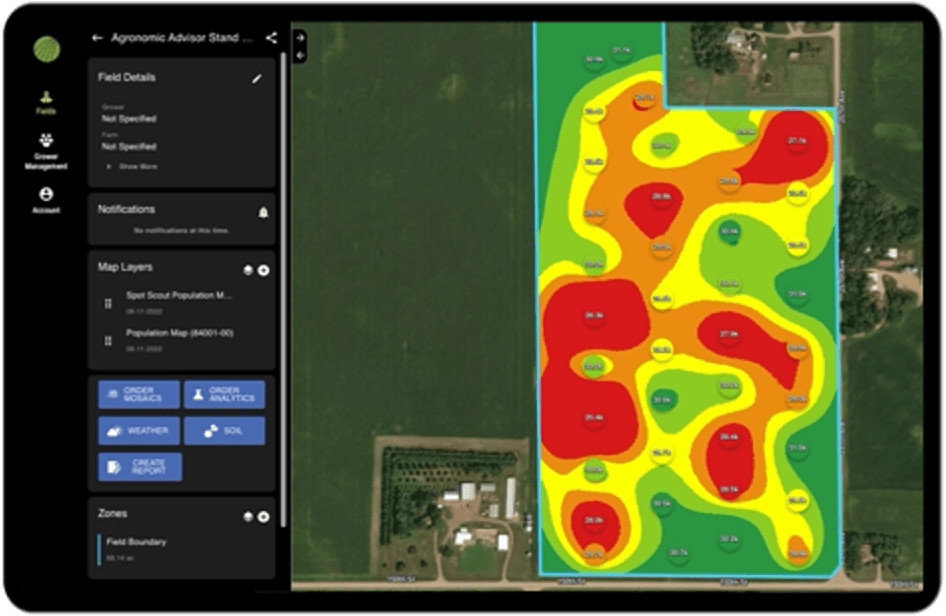
For those in the retail agronomy space, who likely are flying Stand Count to provide data-driven insights to a grower to inform replant or input decisions, Stand Count focuses on providing population counts and emergence numbers for visibility into what’s happening in the field early in the season.
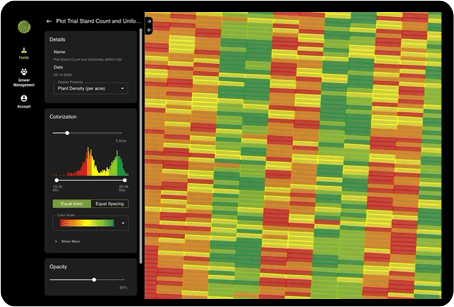
Plot Stand Count and Uniformity analytics offers more data for deeper visibility into what’s happening. This includes the addition of key data points around uniformity.
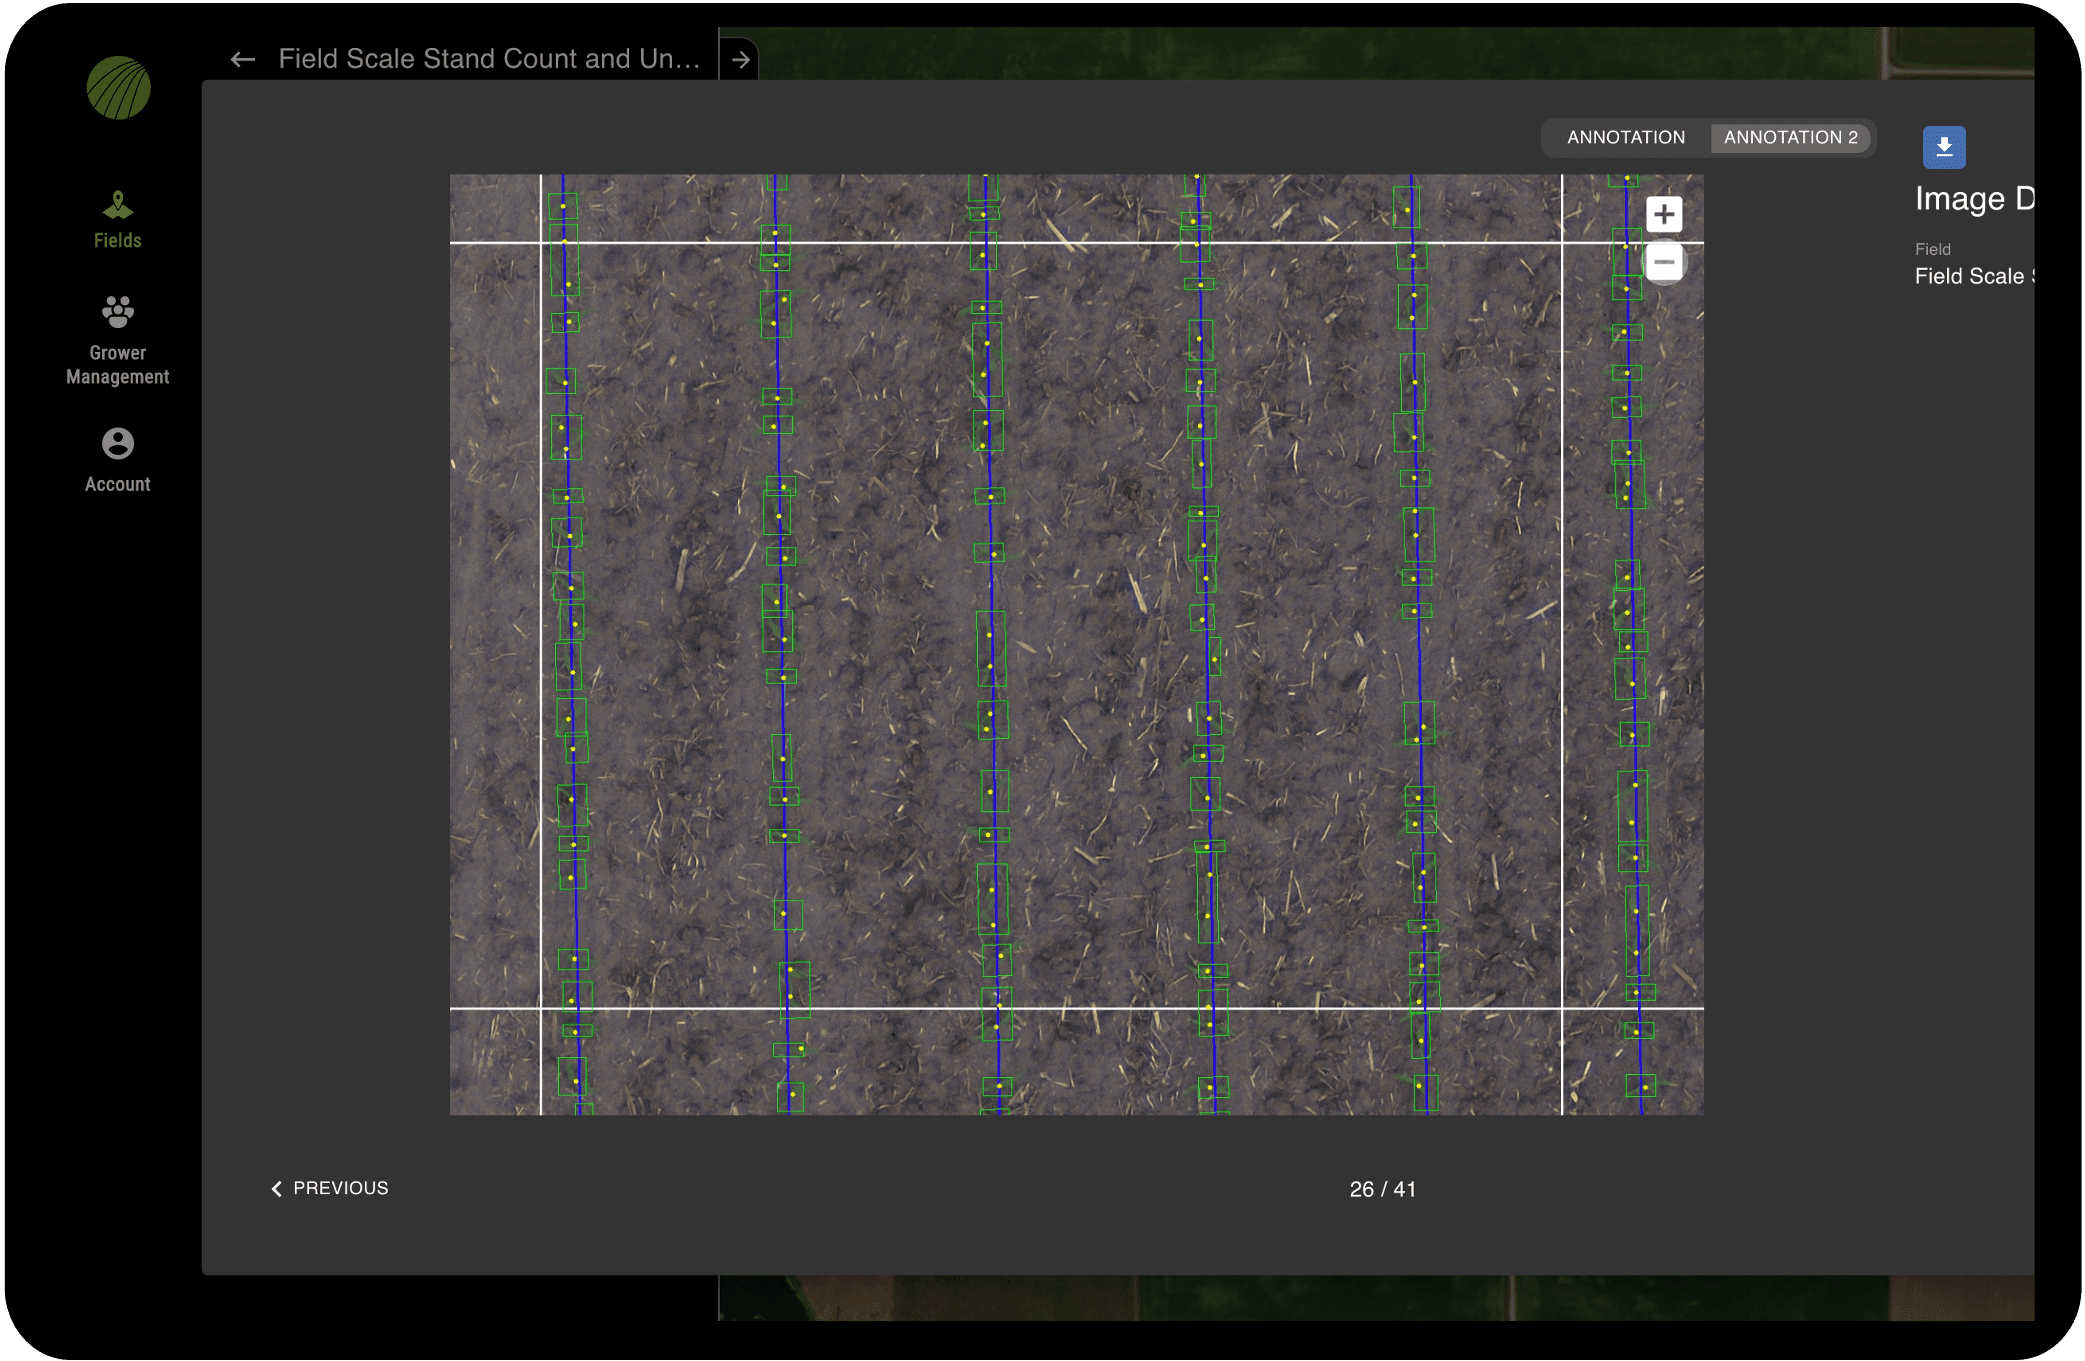
In addition, Stand Count and Uniformity analytics for fields-scale operations, as well as Male/Female Stand Count and Uniformity Analytics are available for those in seed production – providing a combination of what’s available for retail agronomy and plots for analysis.
How to Use Stand Count Data
As one of the first indicators in the growing season about crop health and performance, Stand Count is an instrumental resource to understand emergence and uniformity across every acre and every plot.
Because ag drone systems accurately capture more acreage than manual methods, it provides insight into what’s happening across the field to help indicate problem areas – either points in the field that may need replant or early inputs to augment growth.
For plot trials, it goes beyond emergence data by also providing insight into uniformity – helping to indicate where there may be issues due to seed trait performance or other products.
Uniformity and row fill serves as important for field-scale operations as well; helping to uncover where there may be gaps or areas for replant. Male/Female Stand Count serves a unique purpose for hybrid corn seed production, going beyond the standard emergence data by highlighting population counts, skips, and gaps for male and female plants.
Stand Count Analytics: What’s Included
Stand Count analytics are generated from an RGB sensor. An RGB sensor captures wavelengths of light across bands of red, green, and blue; all of which are visible to the human eye. Sentera’s machine learning platform then analyzes the images to calculate how much green plant material emerged from the dark soil.
The RGB Mosaic sits at the core of the Stand Count analytics, whether for retail agronomy, plots, or field scale use. This RGB Mosaic provides a visual representation – with annotations – of what’s happening in the field, plant by plant.
In addition to that, detailed data sets are available, which can be accessed via FieldAgent, pushed to another solution via API, or downloaded into a preferred format for deeper analysis.
Key data points that are included vary based on the product. For those in retail agronomy, for instance, it focuses predominantly on providing population counts by acre. This provides an indication of where replant may be needed, or where key inputs should be applied to maximize yield early in the season.
Plot-level Stand Count analytics focus on emergence data, but also uniformity and row fill to highlight skips, gaps, and other issues that evaluate the performance of seed traits and inform selection and product development decisions.
Emergence and uniformity data are also included in field-scale Stand Count analytics. In addition to standard Stand Count, Sentera also offers Male/Female Stand Count and Uniformity. This data set offers detailed insight into metrics across male and female row planting patterns to give insight into emergence, helping to support the unique requirements of hybrid seed corn production.
How to Capture Stand Count
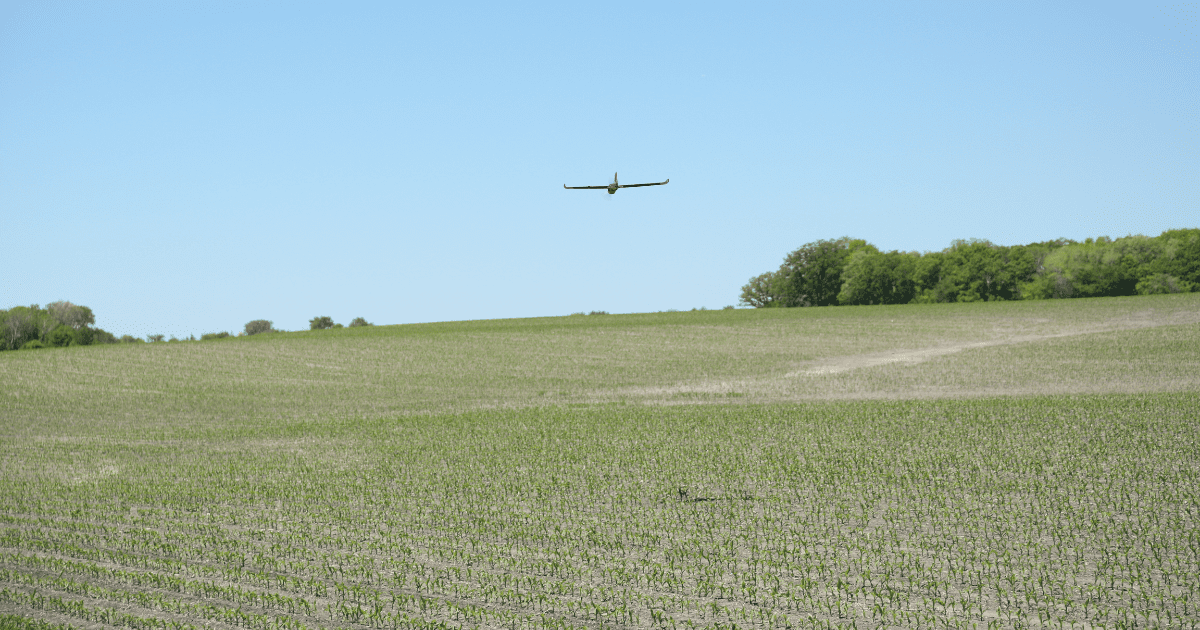
There are manual methods that are used to capture Stand Count, but this blog post focuses on the analytics and data sets generated by capturing aerial imagery.
Sentera offers several sensors that can generate Stand Count analytics.
For those seeking the standard Stand Count analytics set (most popular among retail agronomy customers), the Double 4K, either in the Ag+ or Multispectral models, can be used. The Double 4K is compatible with Sentera PHX, DJI Phantom, or DJI Mavic to capture aerial imagery. For the Double 4K, it is recommended that drones are flown at 50 feet and no faster than 6 mph.
The Sentera 6X Sensors, available as a Multispectral or Thermal, can be used to capture aerial imagery that translates into Stand Count and Uniformity analytics for plots and field-scale needs, most likely for seed production. The Double 4K can also be used to capture this imagery to generate these analytics. In flying a compatible drone, like the DJI Matrice series, with the 6X, it is recommended that it is flown at 70 feet and no faster than 6 mph.
Flying too high may make the plants in the captured imagery too small, and thus, challenging to track; and if going too fast, blurry imagery may also lead to issues in accuracy.
Once the data is captured, it can be offloaded from the sensor and uploaded to Sentera’s FieldAgent for processing. From there, users receive a mosaic and detailed analytics in FieldAgent for further analysis.
Using Stand Count analytics early in the season, agronomists can get an indication of population counts and emergence; helping to identify key areas before they become problematic and negatively impact yield and outcomes.

