As the end of the season creeps towards us, it may feel like what’s done is done – or like a favorite adage says: the hay is in the barn. However, late-season analytics like Tassel Count can provide essential insight into crop yields and overall profitability, both for growers and those working in seed production.
While it can give some essential insight into last-minute decisions for this season, it can also help to inform the season ahead by helping growers determine which seed may perform the best for next year (and take advantage of early pricing gates) or giving seed supply chain experts essential information into how detasseling operations – and help to inform seed production and related forecasts.
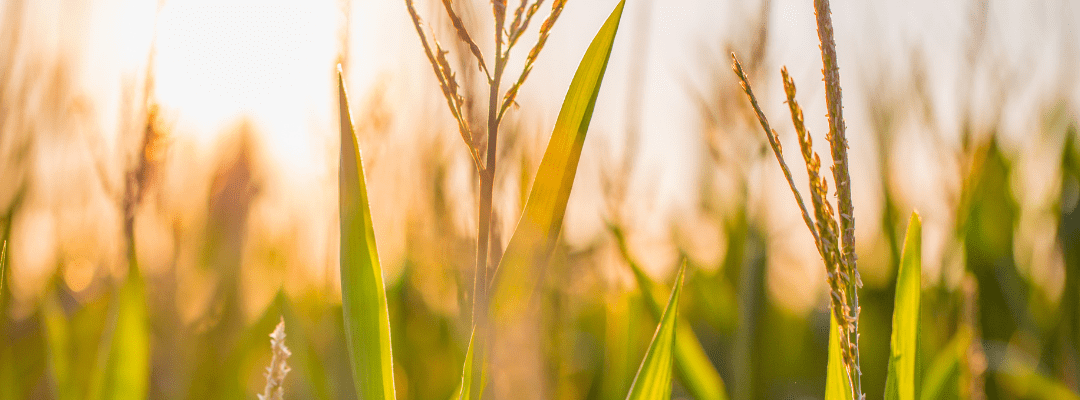
Tassel Count Overview
Tassel Count Analytics are versatile and meet requirements across several use cases. At its very basic level, these analytics are useful to identify how corn crops performed throughout the season.
First off, these analytics can be useful to give an indication into end-of-season yield, which is a useful tool for advisors and growers alike. For many, a sample is taken within the field and based on other scouting that occurred during the season, and estimate is created. By using ag drone technology to capture aerial imagery across the entire field, it gives insight into 100% of the acreage to truly understand how yield looks.
Those working in seed production find that Male/Female Tassel Count analytics are helpful to validate detasseling operations and digitally verify purity. This can help to validate production across the field or even regions, helping to inform seed production forecasts and operations.
How to Use Tassel Count Data
The way tassel count data can be used is as unique as the use cases for getting the data.
For advisors and growers who are seeking insight into end-of-season yield predictions, Tassel Count data can be extremely useful by offering that complete aerial view into field performance. There is an opportunity to inform some late-season input management and decisions; but often times, there isn’t much else that can be done for the season.

Where Tassel Count Analytics really shine, though, for advisors is helping to sell the next season’s seed now. Providing analytics and reports to show growers performance, particularly if they are using different variations across fields, can give a good indication of what may work best for the season ahead.
And, for those that prefer to work in-software for visualizations and data insights, using Zones in FieldAgent can further help to tell the story of what’s happening within different parts of the field – whether its due to different seed breeds or treatment options throughout the season.
Within seed production, flying a drone over the field after detasseling operations means that the imagery can be translated into Male/Female Tassel Count.

The resulting report will indicate where there may be tassels left on corn, helping to identify where secondary detasseling may need to occur – all while digitally verifying the purity of the field.
Tassel Count Analytics: What’s Included
On the advisor and grower side, the Tassel Count analytics provide an updated Stand Count at that point in the season. This can be particularly helpful to compare against Stand Count Analytics that were generated after first emergence – and start to tell a story of what happened during the season.
While initial Stand Count is extremely helpful in uncovering where replant may be needed, using Tassel Count to get an updated population count can be helpful to showcase what happened throughout the season – and how corn crops were impacted along the way. Once you are able to extrapolate this information year over year, it can start to identify trends. Are there particular areas of the field that always perform worse than others? What are the reasons for this – and how do they impact seed and product decisions for the season to come?
Tassel Count analytics for the agronomic advisor go beyond that by using Kernel Count functionality with FieldAgent. This starts by getting a few sample cobs within the field and counting the rows and kernels, which are then input into FieldAgent as a field activity. The analytics then use that data to create a yield estimate based on the representative Kernel Count – helping to estimate the bushels per acre, down to the kernel.
On the seed production side, the Male/Female Tassel Count gives a count of the number of female and male tassels present; and also translates this numerical data into percentages to help validate purity digitally.
How to Capture Tassel Count Analytics
By using aerial imaging technology, more acreage can be captured – faster – to get a true view into end-of-season yields and detasseling operations.

Sentera’s Double 4K, which is known for its versatility pairs with the PHX Fixed-Wing Drone to generate imagery that can be translated into Tassel Count analytics. The Double 4K Analytics sensor, which is a zoom RGB imager that offers multispectral imagery, produces imagery for Tassel Count, as well as other analytics from Sentera – like Stand Count.
As we look to the season ahead, data from this year can tell a story to inform key decisions for what happens. While there is a great deal that’s unpredictable in ag, it means that taking advantage of the predictable can transform operations — and using technology like ag drones systems can help drive productivity and efficiency.
 ! See how Tassel Count analytics can work for your unique use case to maximize the season.