Advances in technology like remote sensing have made it easier to capture crop health insights, and it has also given rise to other measurements that are crucial for an accurate canopy analysis. Here at Sentera, our Canopy Cover analytics offer more depth and insight for precise insight into what’s happening during a particular growth stage.
Canopy Cover Analytics Overview
Canopy Cover serves as a valuable analytic to understand how plants are growing, developing, and maturing throughout the entire season.
With the ability to characterize growth stage, for instance, it can be an early-season health indicator to understand plant growth and stress.. It can also provide an indication of yield potential – helping to inform key selection decisions for product development.
Canopy Cover analysis can be leveraged for several key crops, including:
- Corn/Maize
- Soybean
- Cotton
- Small Grain
- Canola/OSR
Sentera offers several different Canopy Cover analytics products, depending on the customer segment and use case.

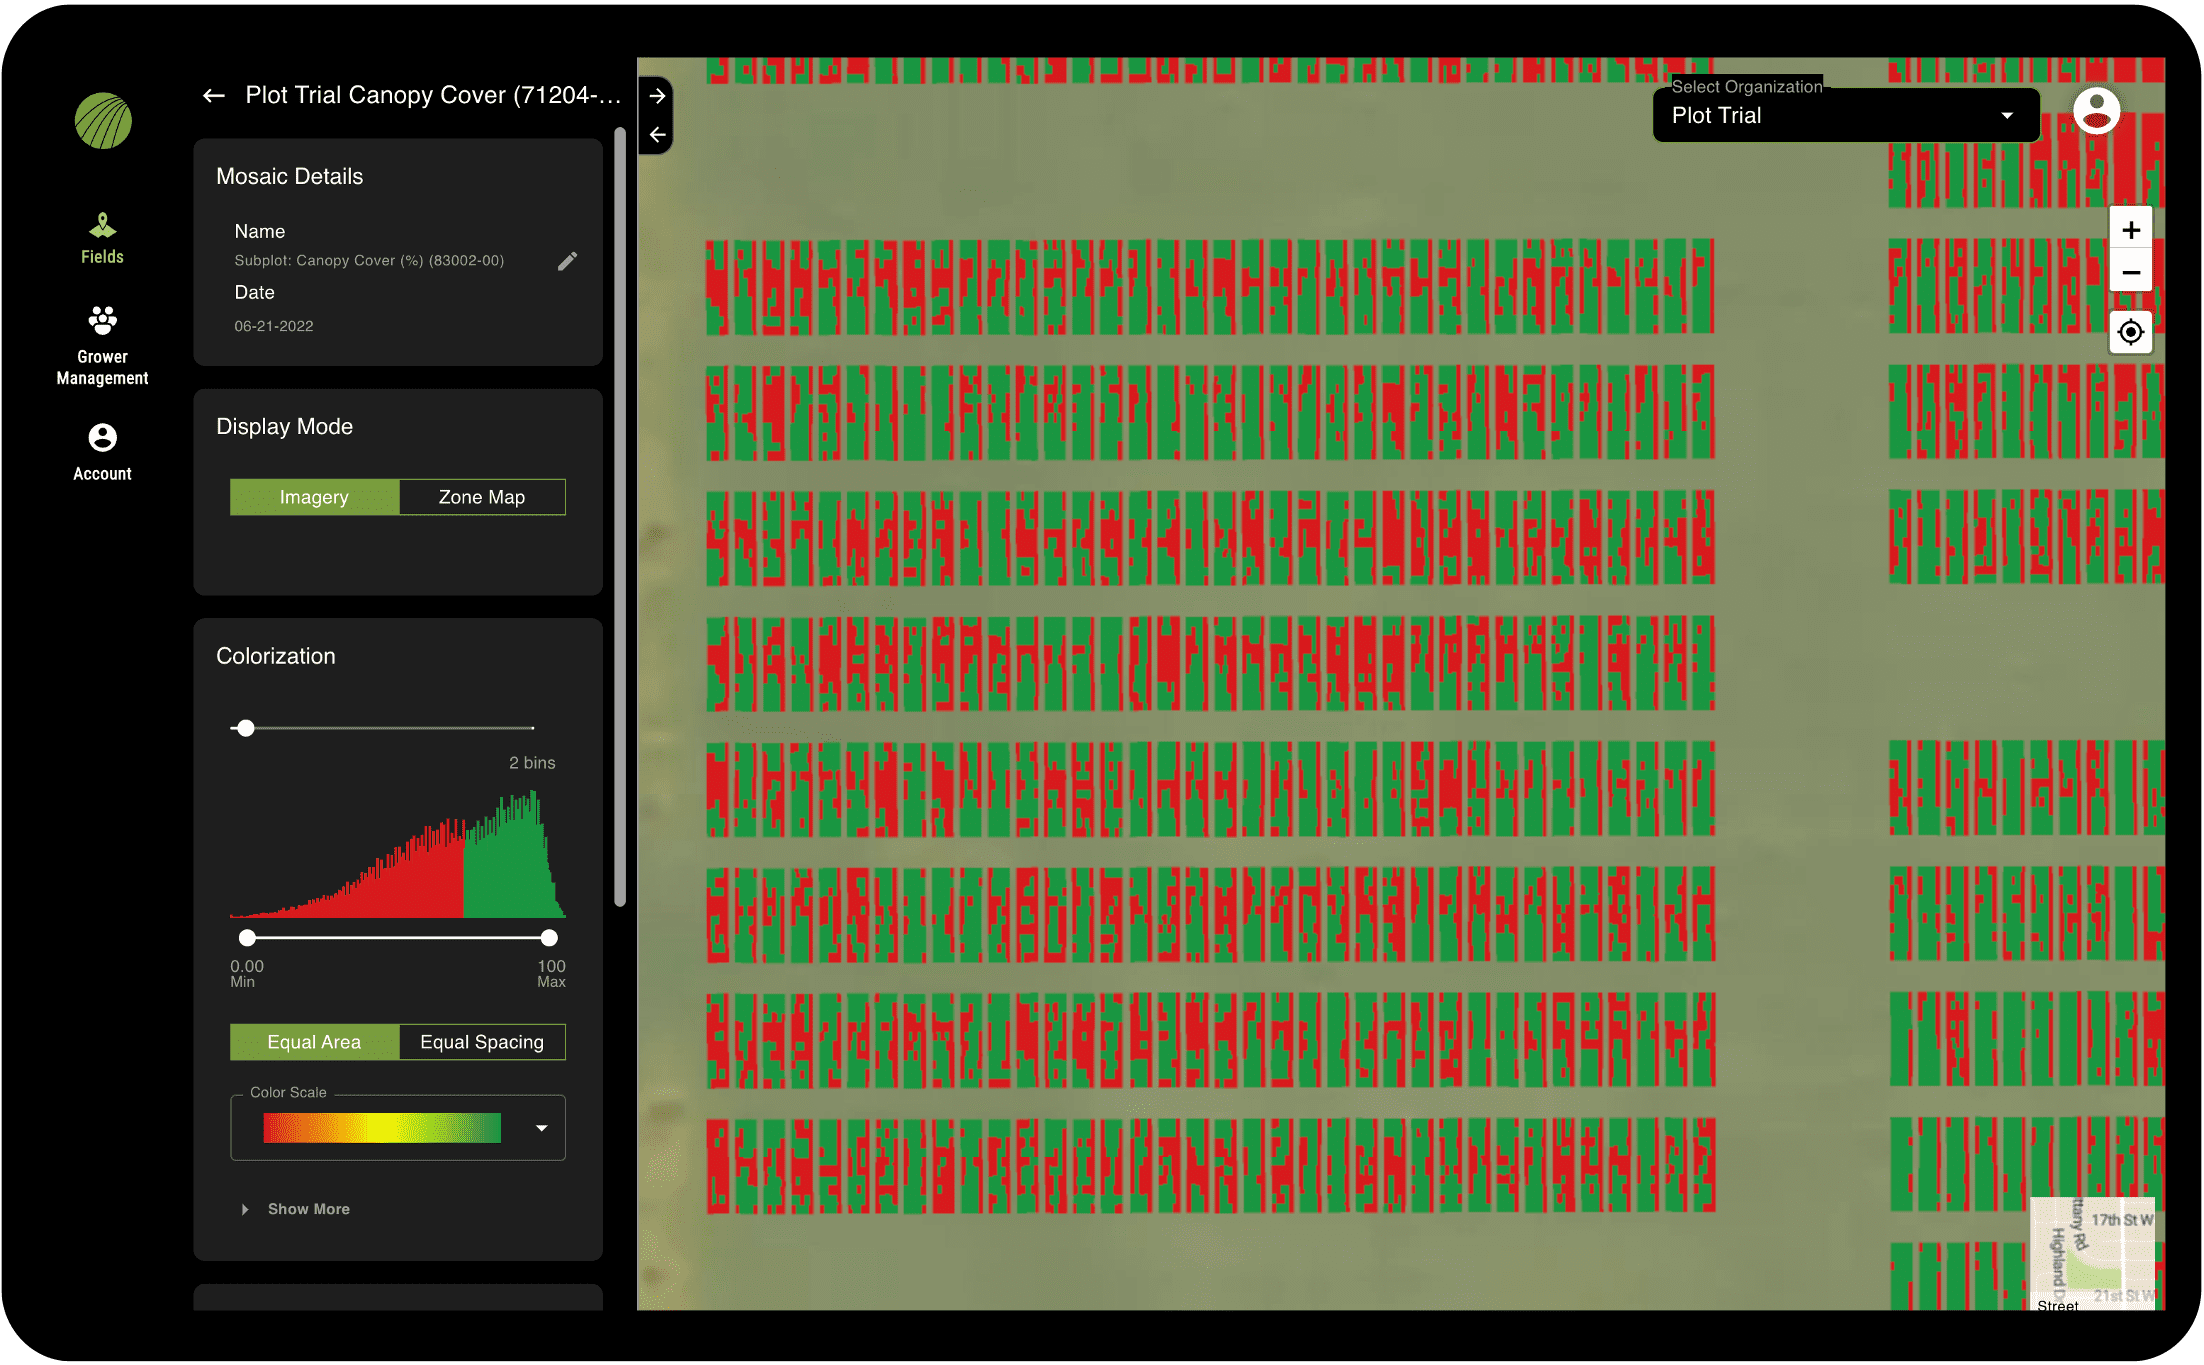
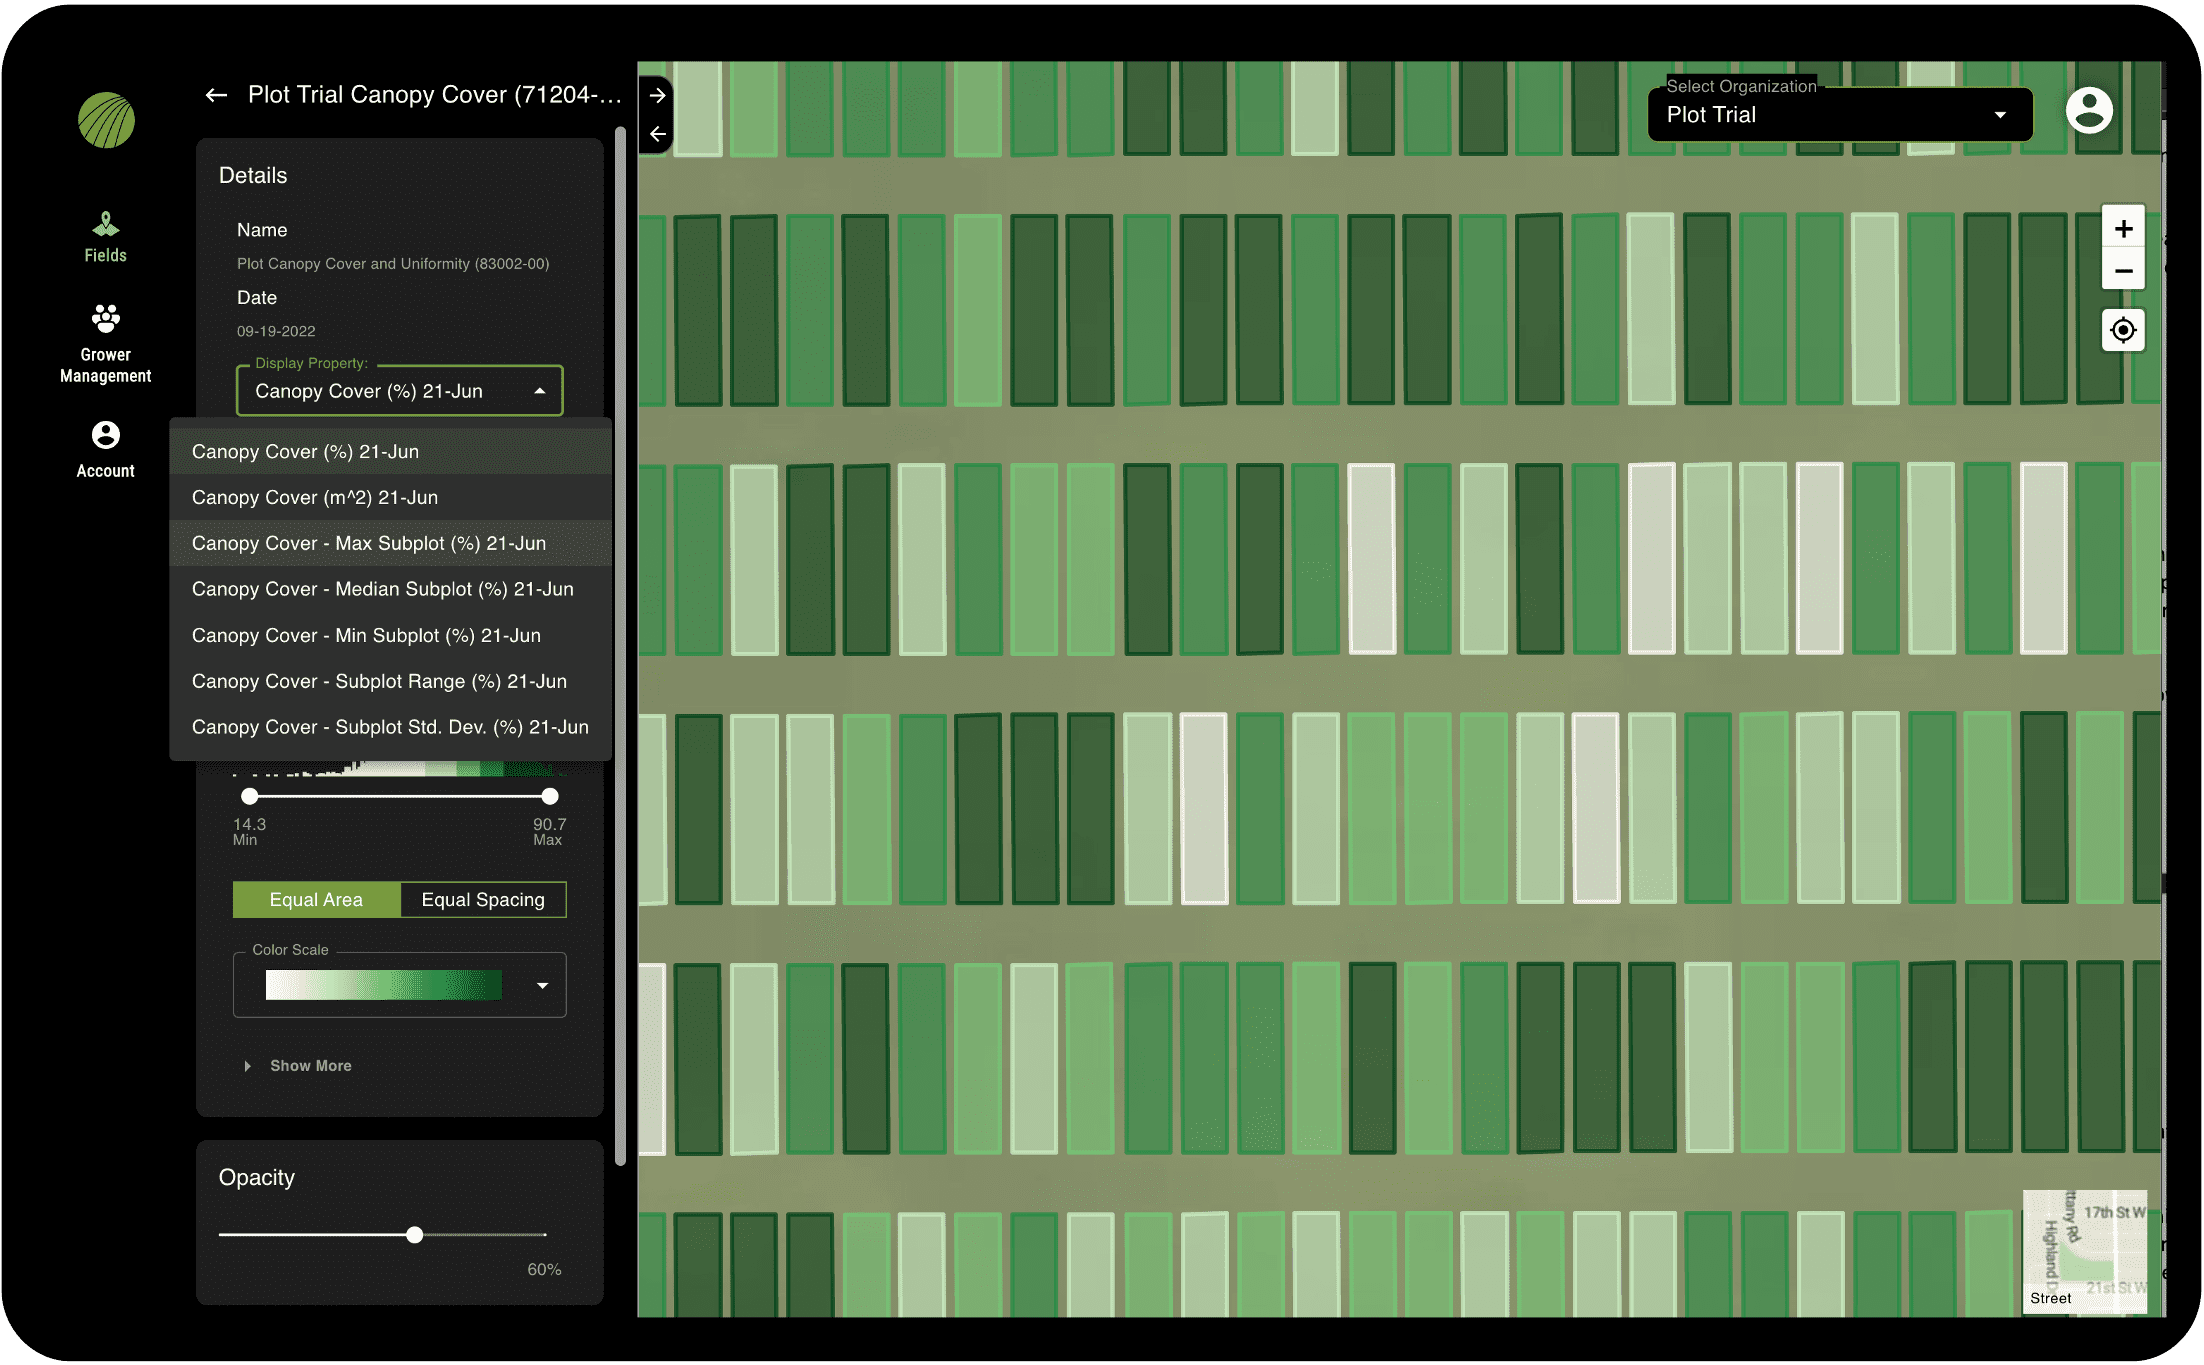
For our customers in research, Canopy Cover also incorporates data around the subplot. Field scale operations use canopy cover to get spot scout insight across acreage, helping to pinpoint problem areas.
For customers in Permanent Crop, our analytics provide insight into tree canopy extent area size by delivering tree-level summary statistics.
How to Use Canopy Cover
Because Canopy Cover analytics provide insight into crop development and maturity throughout the season, it can be used for a number of use cases.
Canopy analysis focuses on understanding the ecosystem within a plot area or field; and by having this insight, it can inform key decisions throughout the season.

It is also a useful resource to help inform product development decisions. By understanding how crop growth stages progress throughout the season, it can give an indication of how seed traits perform given certain conditions – and, for product development, offer insight into ideal conditions for input application.
Canopy Cover Analytics: What’s Included
Sentera generates Canopy Cover analytics with high-resolution aerial imagery captured via an RGB sensor. Its proprietary machine learning platform then translates the images into detailed measurements and data sets for analysis; and in doing so, standardizes the data sets to eliminate variability. This makes it easy to capture Canopy Cover at different points in the season, helping to inform the development story and track crop growth over several points in time.

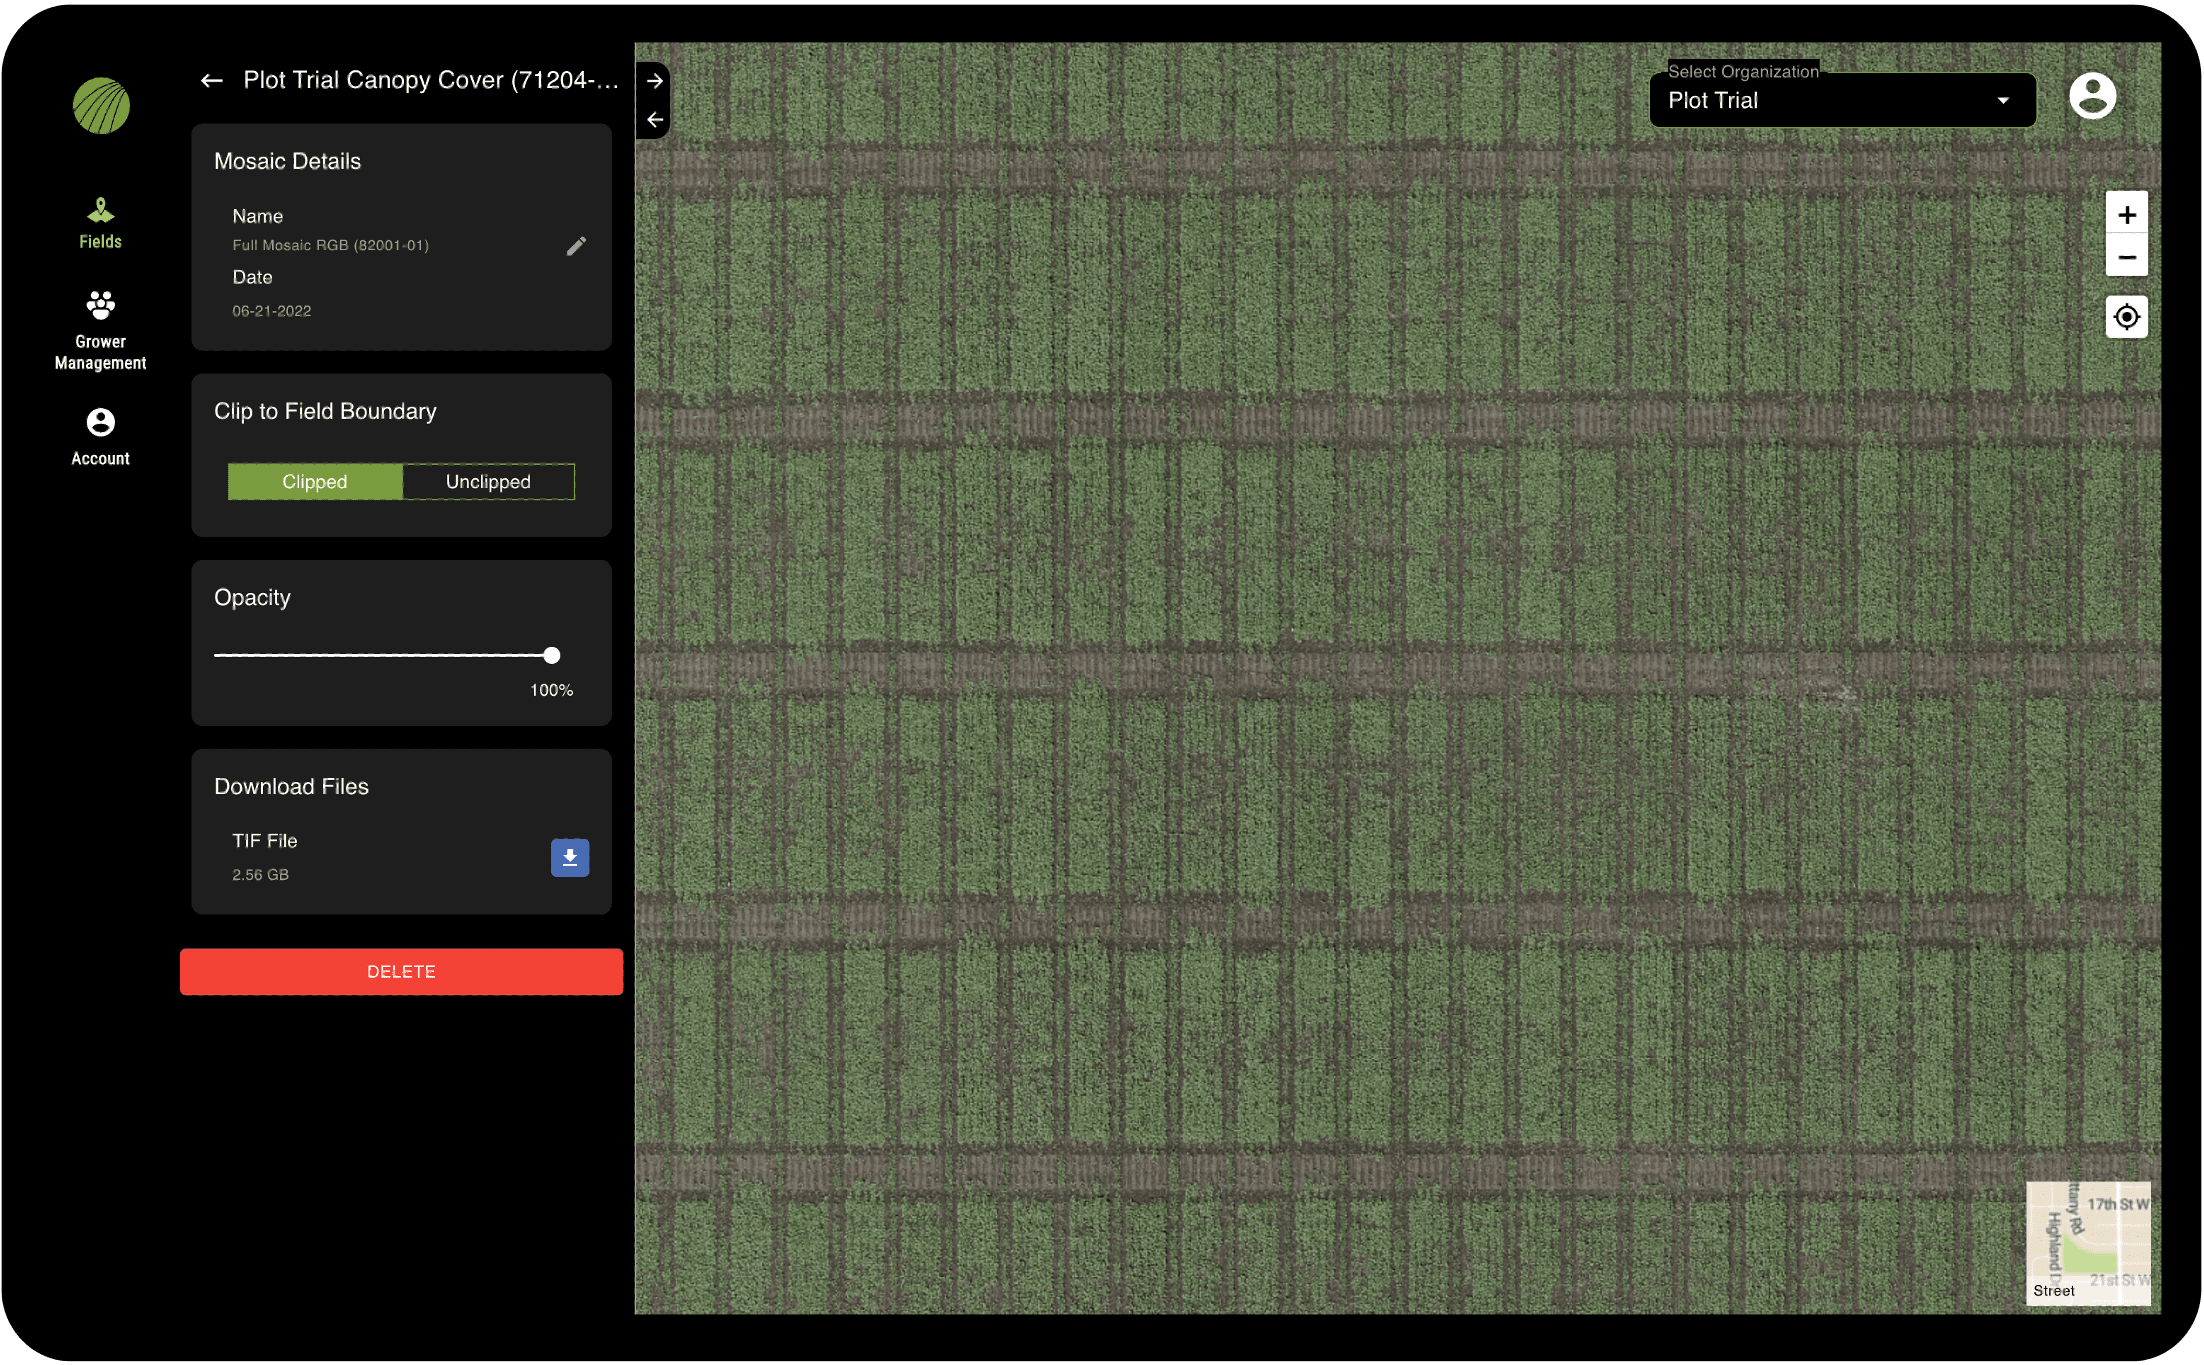
The RGB Mosaic serves as a key data point for canopy analysis; providing a visualization of what’s happening within the field.
Detailed data sets that are part of Canopy Cover include summary statistics to give an indication of Canopy Cover and Uniformity. For our plot-level Canopy Cover analytics, data attributes that are also available for analysis include subplot analytics, like standard deviation, min and max subplot, as well as the percent of the plot covered by vegetation.
How to Capture Canopy Cover
Capturing canopy data differs depending on the time of year. The changing vegetation requires different flight altitudes and speeds in order for drone systems to accurately capture the RGB imagery.
Here’s a snapshot of what that may look like when using Sentera sensors to capture Canopy Cover:

With the advent of drone technology, canopy analysis has become a more popular measurement in recent years – mostly because the barrier to gather the data has been eliminated. Unlocking the power of Canopy Cover analytics can provide immense benefits throughout all plant growth stages, from early-emergence to late-season canopy cover.


