From providing deeper data insights into crop health and performance to significantly reducing data collection and analysis workflows, new technologies launched in 2022 will help accelerate crop production throughout its entire lifecycle in the seasons to come.
Often, lifecycle refers to a plant’s growth throughout the growing season – from when it’s planted to mid-season health checks to end-of-season harvest.
But, in this case, we’re doing a deeper dive into four key areas that drive the field of agronomy ahead:
- Research & Product Development
- Plant Breeding
- Seed Production
- Sales & Marketing
What is the Crop Production Lifecycle?
It starts with research and product development, which fuels the future of agronomy (and may make the 500-bushel field commonplace?).
It continues with plant breeding and seed production, which helps to bring these new varieties to market. Over the past 25 years, adoption of new seeds has grown considerably. The USDA estimates that 90 percent of U.S. corn, upland cotton, and soybeans are produced using genetically engineered varieties, which includes those that may be herbicide tolerant or insect resistant (or a combination of both).
And lastly, as we look at the full cycle of crop production, it continues with performance marketing to validate how these new seed varieties and products perform in the real world; helping to build better grower relationships and augment data-driven decisions.
Over the next few blog posts in this series, we’ll explore each step in the crop production lifecycle and highlight how advancements in technology helps to accelerate these stages – all to fuel a more efficient and cost-effective future for crop production, helping to support growers while meeting the increased food productivity needs of our world.
So, let’s start with research and product development.
Research & Product Development: The Role of Technology

For researchers and product developers, understanding performance throughout the season serves as imperative to assess trials and validate outcomes.
However, capturing plant-level data throughout the season has traditionally relied upon people in the field manually counting and rating plants based on performance factors. This not only increases the likelihood of erroneous data (especially as rating can be highly subjective), but also limits how many plants can be assessed during a particular timeframe.
Using technology like ag drones and sensors has transformed this process. It gives researchers and product developers access to tools that can capture whole fields of data in a fraction of time that it would take to sample the field, while removing the risk for errors.
There are a few key benefits for relying on this technology for this step in the crop production lifecycle.
For one, let’s talk about the measurements and data that are delivered. Using drones to capture high-resolution aerial imagery means you can capture more plots and fields in less time – giving you data points across all plants, not just a sample set or two.
In addition, more detailed measurements and data that go beyond what may be visible to the human eye – giving more insight into performance and what that means for key outcomes.
How these measurements are delivered is also important – after all, most of the time once these manual data points are collected, it requires time and resources to get them into a readable and comparable format. What if that was all automated, too?
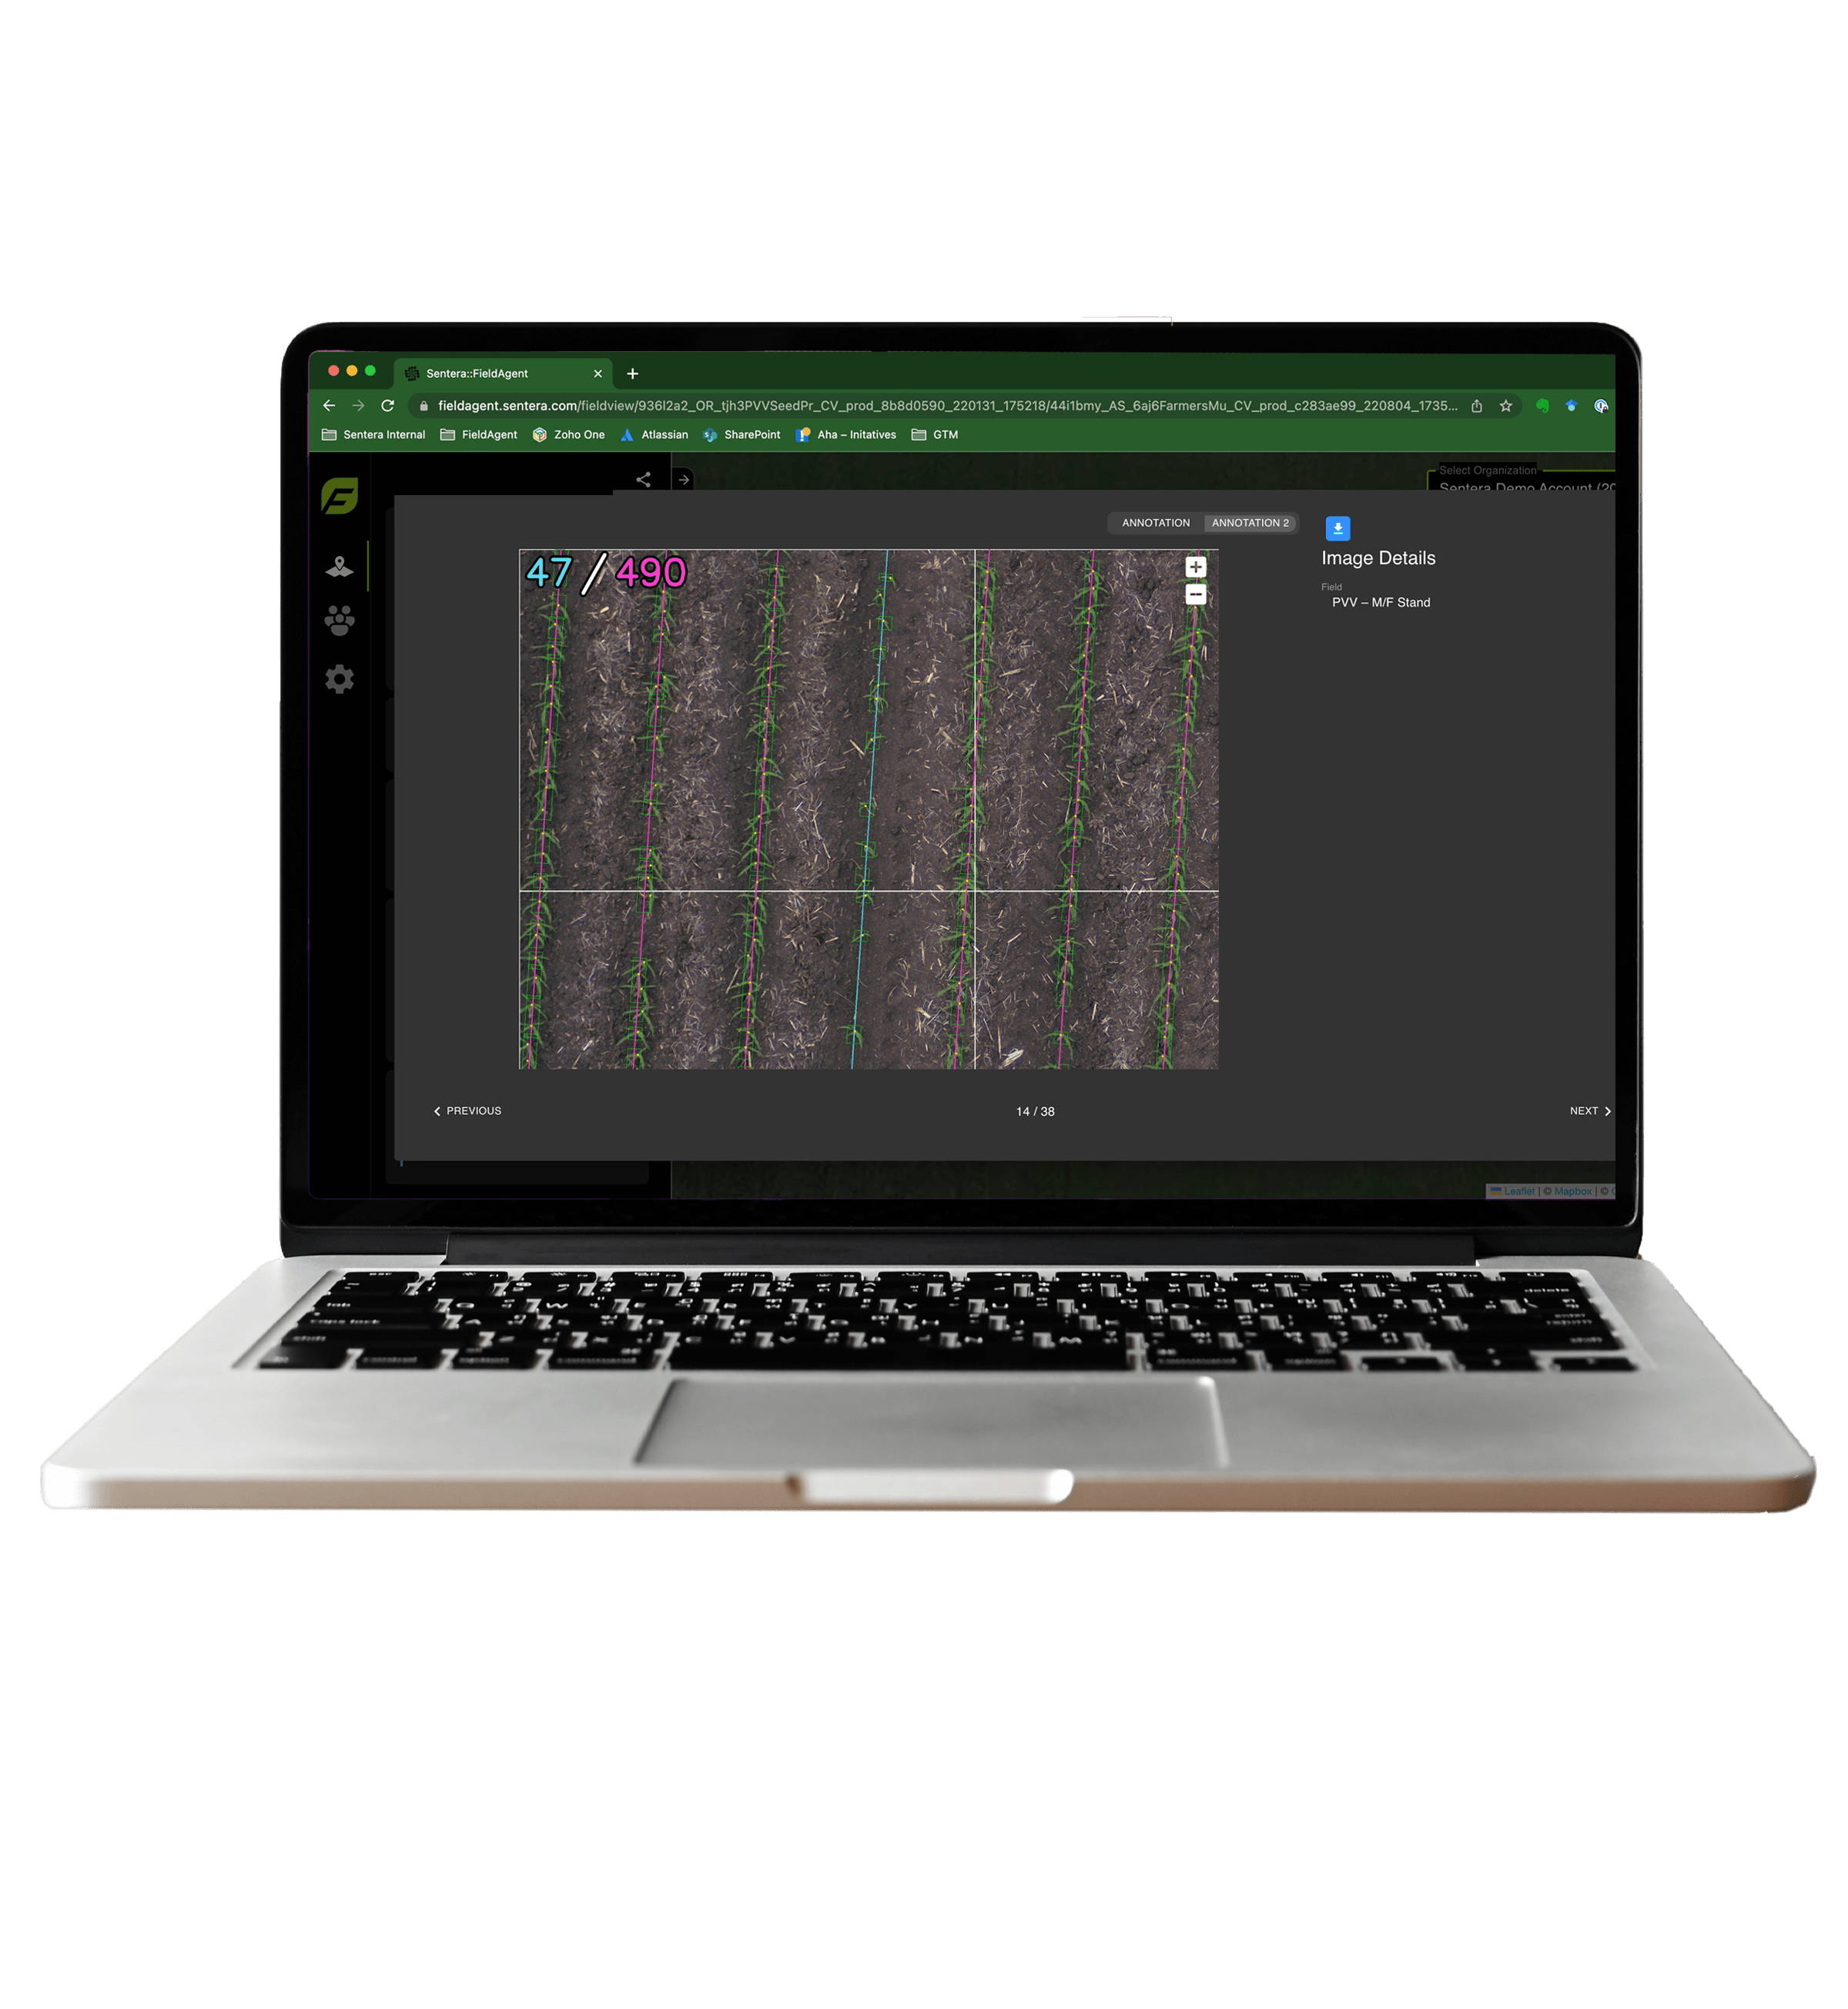
While the high-resolution aerial imagery can be used for analysis, these images can be translated into detailed data sets with machine learning, which powers Sentera’s FieldInsights. Machine learning transforms these images into numerical measurements, which are then delivered via a spreadsheet or for visualization in a software platform.

An example of this would be with Stand Count. This is often a referred early-season indicator to understand emergence rates. Most likely, this data is captured by manually counting the number of plants in a few areas of the plot or field to get a rough estimate of what the emergence rate may be.
Instead of relying on manual labor to get here, what if a drone captured high-resolution aerial imagery? And then, machine learning turned this data into detailed measurements.
In addition to knowing how many plants emerged, you could track key data points like:
- Seed spacing (which can be compared to a seeding rate)
- Gaps that are larger than what’s expected
- Plant surface area
- Plant width, canopy cover
- Total vegetation cover. (including vegetation between rows for an indication of weed cover)
And, these data points are captured in a fraction of time that can be done with manual methods – which gets us to another key benefit for using technology to capture crop health and performance for research and product development. Timely delivery of data can power faster and more precise agronomic decisions, helping to inform key inputs throughout the season.
Because this data can easily be captured at many points throughout the season – all with a standardized method to fuel validation – it creates a roadmap of validation. It gives numerous checkpoints throughout the season to understand performance, making it easy to pinpoint key inflection points for performance.
Technology Adoption: Key Best Practices
Leaders in research and product development are faced with a challenge when it comes to adopting technology. After all, it adds another step in the process – and another variable that can impact results.
As researchers know, starting with the end in mind works best – and that applies to adopting new technology for measurements. Start by understanding what you’re trying to accomplish, which includes:
- Identifying your key goals (what will technology do for you?)
- Uncovering the data sets you wish to obtain (what measurements will you capture?)
- Determining your technology tools and resources (what ag drone system will you use and who will fly it?)
- Articulating your use case (how will the ag drone system be used in coordinating with your trials?)
With that in mind, building out a plan to execute throughout the growing season becomes quite simple. And, with less emphasis on manual labor and more support from technology designed to get the job done faster, it means a more reliable source of information – all without having to sacrifice precision along the way.


