What happened and why?
For ag research and product development leaders, this isn’t a foreign question. In fact, it is likely at the core of every project and initiative, helping to uncover the results and understanding what precipitated those findings. And, as we all know, in agriculture, the unpredictability of many factors can make this far more challenging.
Getting detailed and reliable insights on your plots serves as essential pieces that are core to understanding what happened throughout the season. The ability to turn these crop measurements into key decisions to power future outcomes (whether congruent to initial results).
Aerial Imagery’s Role in Ag Research
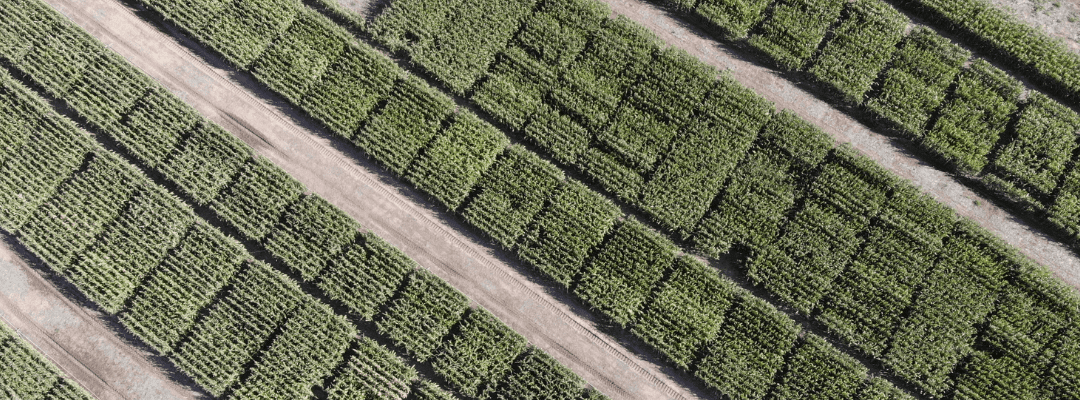
Imagery has been more recently introduced as a method for sampling and as a new data set for researchers and product developers. From satellites to ag drones and sensors, technology has stepped up to provide the coverage of plots needed to understand performance and validate outcomes.
As any researcher can attest, days in the field focused on capturing mass samples of plants across plots result in pure physical and mental exhaustion. From hours in the sun to analyzing hundreds of plants, the aches and pains go beyond muscles – often translating into challenges with the data sets. Human error is inevitable. But combined with the ability to only capture so many plants in a designated period of time, the resulting data may give only a glimpse into the full story within the plot trial.
Aerial imagery has transformed this data collection process – eliminating much of the back-breaking work in the field and giving researchers the tools to standardize data collection to get detailed data sets across full plot trials. The ability to capture 100% aerial imagery has opened the door for new opportunities for including more plots in a single trial, helping to provide further validation across data sets.
Technology, like drones, provides a more efficient option that enables more frequent observations. Whether flying yourself or hiring a team to do it for you simplifies the data collection process and makes capturing full data sets a much quicker process. This makes it easier to find time to replicate it throughout the season to generate imagery at multiple points for a more detailed view of “what happened.”
Lastly, UAV imagery captures more crop measurements across the entire field, but it also results in a more comprehensive set of agronomic traits. Instead of rating plants for overall traits, aerial imagery can be translated into detailed data sets that provide actual measurements of specific plant traits, like surface area and width, as well as overall planting trends, such as gaps, vegetation cover, and plant density.
These data points are supplementary to telling the full story of the “what” and “why,” – which are often tightly linked based on insights that may not be available with more mainstream data collection processes. As many researchers and product developers may agree, it never hurts to have more data – especially if it can help tell a better story. This may not be possible (or realized) without having the tools available to capture these additional measurements.
UAV Imagery Translated to Agronomic Crop Measurements
How does an aerial image of your plot trial translate into a measurement that you can view and compare to other points in the season? Using its proprietary machine learning platform, Sentera takes these images and translates them into numerical values to give crop measurements true value for researchers and product developers.
The result focuses on three key elements:
Real-world units. Evaluating aerial imagery, particularly multispectral, can leave room for interpretation. Translating image sets into numerical measurements turns them into quantitative measurements that can be compared throughout the season or even year over year.
For initial emergence, for instance, understanding absolute plant count accurately represents how many plants are on the field on a particular data. It eliminates human error and even erroneous data that may appear due to estimating sampling data.
Agronomic interpretation. What good are ag research and product development data sets if you cannot understand what that means from an agronomic perspective?
As you evaluate the detailed data sets generated by aerial imagery, recognize that these numbers can be interpreted for agronomic value. Then, applied against key factors like the number of growing degree days or average rainfall within a certain period. Applying these factors an help the measurements tell a broader story as you validate outcomes.
Parity with existing measurement methods. Being able to compare data sets over time serves as imperative, particularly for plot trials. Using aerial imagery doesn’t mean old data is worthless; instead, it can offer some standardization for future data collection while continuing to tell the story of field performance.
It also means that UAV imagery can readily complement other measurement methods in place; it doesn’t have to be an all-or-nothing approach. Having supplemental data points to validate additional measurement methods – or even available for further analysis – helps to augment research validation.
Real-world Example: Plot Trial Stand Count and Uniformity from UAV-based Imagery
That’s great, but what does this mean in practice? Let’s look at a few resulting data sets from UAV imagery translated into agronomic crop measurements.
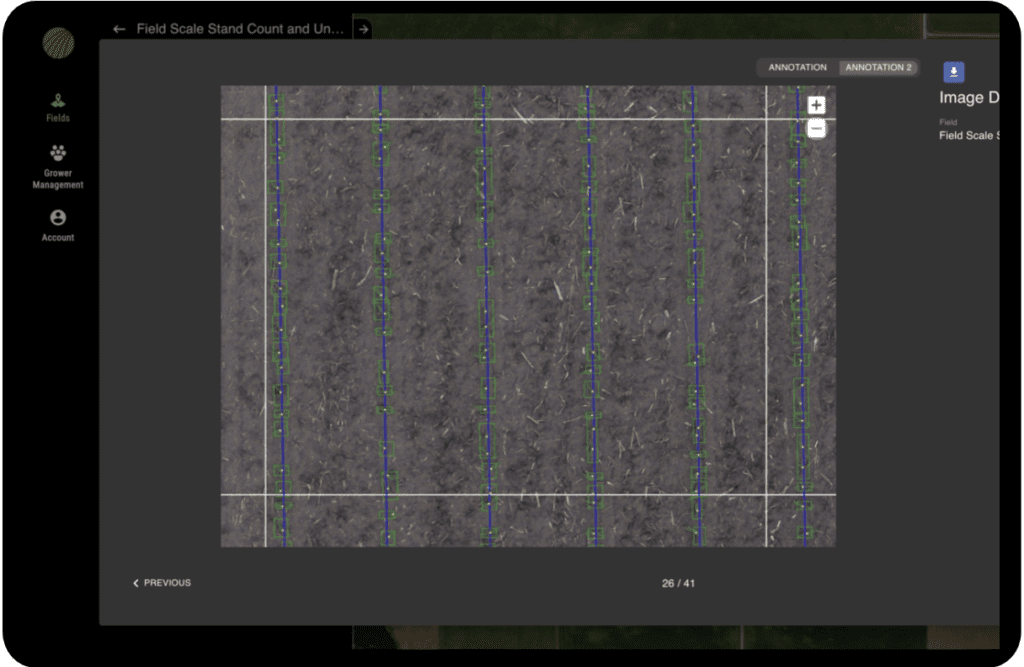
Plot Trial Stand Count and Uniformity provides insight into crop emergency across every acre and plot to:
- Enable critical in-season management from the first emergence
- Evaluate the performance of seed traits and inform selection/product development decisions
- Capture key metrics related to male/female row planting pattern
This analytic set from Sentera gives insight into plant count and related uniformity statistics, with up to 25 distinct measurements, including uniformity statistics to quantify within-plot variance. Key data points include:
- Plant population
- Gap analysis
- Seed spacing
- Canopy cover
- Weed cover
Plot Trial Canopy Cover and Uniformity is another analytic set available from Sentera. Using this data, quantify the fraction and uniformity of green vegetation to:
- Monitor canopy development
- Characterize growth stage, development, and maturity
- Measure early-season canopy uniformity
This data set includes measurements that identify key time-varying traits that signal the rate of crop growth, senescence, or incidence of crop damage. Because of the ability to do more with UAV imagery, such as capturing data more frequently across all of your plots or acres, while getting to measure more agronomic traits in the process. This data set becomes even more useful to analyze crop performance throughout the season, understanding how key inputs impact maturity and vigor.
Crop Measurements: Because More Matters
Regarding crop measurements, researchers and product developers have historically been challenged to capture additional data points and detail due to the processes that have been available to them. After all, there’s only so much time in a day – and with only so many days in a season, it’s challenging to increase the frequency of manual methods.
But leveraging technologies to capture UAV imagery boosts the efficiency and reliability of the data being captured – all while cutting down on the time to do so.
Quantity matters. More measurements help tell a complete story for validating performance outcomes, resulting in a better understanding of what’s happening. And more opportunities to capture data help to further validate outcomes – leaving out any question of how different inputs and unpredictable factors impact performance.
 ."
."