As we near the end of this year’s growing season, it’s time to begin planning for next year – including when and how you should be using data analytics in agriculture. From measuring initial emergence to giving a last indication of yield potential, analytics provide deeper insight into fields and plots to assist in fueling agronomic decisions and validating outcomes.
With such a wide variety of ag analytics, it is important to understand how time of the year and what you’re looking for factors into which to use. In this blog post, we will showcase some of our favorite resources to leverage throughout different stages of the growing season.

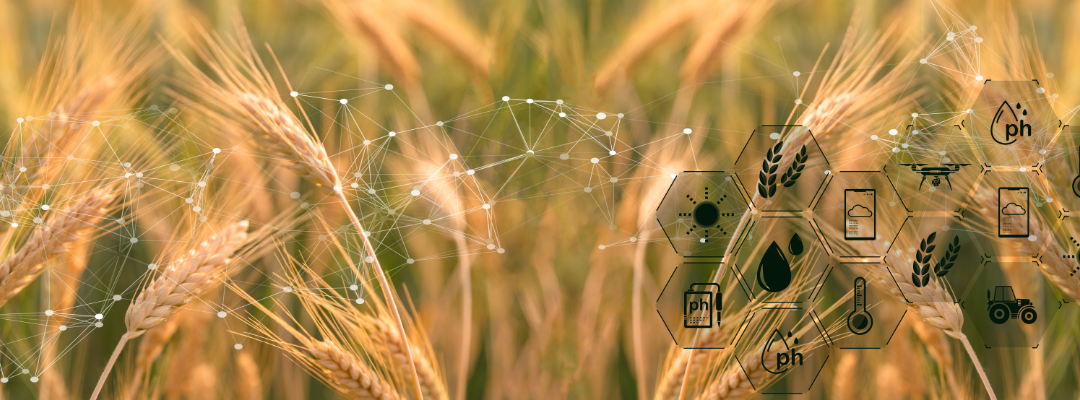
1. Field Analysis: Performance Beyond Roots and Stalks
Post-harvest is the perfect time to get a head start on the upcoming season because it is truly never too early to begin your planning. After the season has ended, conducting a field performance analysis can tell you just what you need to adjust and plan for a more successful future year. This is when these post-season analytics provide immense value, including Residue Cover and Elevation and Hydrology.
After you harvest, assessing soil health and quality is key in determining your plans for the upcoming year – as soil is arguably the most important factor. Residue Cover uses remote sensing to capture insights into soil quality and health, helping to:
- Manage erosion
- Conserve moisture
- Build and store organic matter
- Fuel soil management decisions
With Elevation and Hydrology, you’re able to assess your fields or plots topography, providing insights on areas that performed better, problem areas, and water flow. Topography is key in understanding which areas are susceptible to flooding or which areas performed better in past years. Aerial imagery provides a unique view that provides a clearer picture of what is happening at the field-edge, helping to inform future decisions around water management and planting.

2. Crop Insights Deep Dive: Stand Count
Crop emergence is the first sign that the season has commenced and the start of building your season’s story with data. Stand Count analytics provides the first indication of plant population count and emergence percentage across a plot or field. This early-season data is captured by aerial imagery from ag drone sensors, like Sentera’s Double 4K and 6X sensors.
These analytics provide value in both field-scale operations and research plots. With the variations of Stand Count its versatility can be used in different operations ranging from using Male/Female Stand Count for seed production to plot-level Stand Count focusing more on emergence and row fill.
Stand Count analytics provide valuable insights that can assist in fueling decisions, validating outcomes, and measuring performance. By understanding plant population and uniformity, you’re able to determine if you need to replant, if a certain product is performing up to par, or if a certain area is in need of certain inputs.

3. Enhancing Crop Research with Drone-Based Agricultural Analytics: Next Steps after Plot Stand Count Results
So, once Stand Count analytics are captured what are the next steps? Further analysis can be done early season right after initial emergence data is measured and collected, including:
Monitoring crop health with vegetative indices and multispectral sensors (Sentera’s Double 4k or 6X Sensor), helping to detect stress or disease. Identifying issues facing crops helps to make timely decisions and proactive measures, helping to limit potential damage.
Analyzing canopy with Canopy Cover analytics to get a look into how your plants are growing, developing, and maturing throughout the season. Canopy analysis can be used to determine product or trait performance and also pinpoint potential problem areas efficiently to make the necessary adjustments.
Phenotyping and yield protection captured by drones opens the door to high-resolution data on plant traits like height, canopy, and flower cover. This offers a comprehensive look at how a plant develops in carious environments and how that impacts yield – better understanding product and trait performance while working towards higher productivity.
And even more, valuable analytics and tools are available to dig even deeper as the season progresses.

4. Crop Damage from Storms & Weather Events: How Remote Sensing Can Help
One of the most unpredictable factors that agriculture deals with is weather. Although it would be a lot nicer, you can’t control when it’s going to rain, the path of an extreme weather event, or the speed of wind. Though you can’t control the weather, you can prepare for it, monitor it, and assess its impact. Remote sensing can be leveraged before and after weather events, even during some.
Before weather and climate events take place, remote sensing can assist in informing the best management practices to assist in mitigating the potential impact. Let’s use drought as an example, Elevation and Hydrology work to identify and model water flow helping to understand areas prone to flooding or drought. This information can be used to inform decisions around planting patterns and irrigation strategies.
NDVI plays a key role in identifying crop stress during these weather events. During drought it assists in directing you to areas experiencing significant stress and helps in determining which areas are in need of attention. While it doesn’t uncover the why, it is resourceful in pinpointing the what and the where.
Sentera’s Crop Damage analytics also assist in forming mitigation strategies for these weather and climate events. These analytics offer fast and accurate insight into the location and extent of the damage stemming from weather events. This helps to inform mitigation, update management strategies, and even in situations involving insurance.

5. Crop Insights Deep Dive: Height & Lodging Analytics
As the season approaches harvest, wheat plants are at high–risk for lodging – which can lower yields and the grains quality. Gaining insight into lodging and the height of crops can assist in understanding damage, seed trait performance and characteristics, and informing action plans to resolve issues they may be dealing with.
Height and Lodging analytics are a way to support researchers, product developers, advisors and growers. The insights provided by lodging analytics provide a deeper understanding of its impact on canopy height and growth throughout the season.

6. Crop Insights Deep Dive: Tassel Count
And last, but certainly not least, we recommend Tassel Count analytics, which serve as a late season guide to understanding final yield and assist in harvest planning. When trying to gauge what your final yields are going to look like, high-resolution aerial imagery provides the most accurate and precise look into predicting its potential.
While this is a valuable analytic for growers and agronomic advisors in providing an indication of end-of-season yields, it can also be leveraged to formulate harvest plans and better understand product performance for ag researchers and product developers.
An aerial view of your field or plots gives a better indication of performance and an opportunity to make late-season input management and other decisions to boost yield potential. If you’re using different variations across fields or plots, you are able to get a clear picture of which is performing best and fuel purchase decisions for next year.
These late-season analytics have the potential to boost productivity while fueling more informed decisions to get ahead of the upcoming growing season.
 .
.